Curated OER
Reaction Kinetics and Rate Laws
In this reaction kinetics worksheet, students draw a graph of energy vs. reaction progress and determine the factors which change the speed of a reaction. Students learn about rate laws. This worksheet has 1 graph, 15 fill in the blanks,...
Curated OER
Variables, Formulas, Functions, Graphs
For this function worksheet, students are given 6 short-answer problems regarding formulas vs. functions, graphing functions and different ways to view functions.
Curated OER
What Influences Reaction Rate?
Students study reaction rates, what determines how fast a reaction happens and how the chemical changes occur. In this reactions instructional activity students complete a lab where they use Alka-Seltzer to observe reaction rate and...
Illustrative Mathematics
Video Streaming
Your movie fans will be interested in this resource. They will compare video streaming plans. One plan charges a set rate per month and a reduced viewing fee, and the other has a flat rate per each video viewed. Unfortunately, students...
West Contra Costa Unified School District
Average Rate of Change
The concept of slope gets an approachable, yet theoretical, treatment in a comprehensive algebra lesson. The use of functional notation and problem-solving techniques keep the material rigorous, but detailed teaching notes and lots of...
Illustrative Mathematics
Velocity vs. Distance
At the end of this activity, your number crunchers will have a better understanding as to how to describe graphs of velocity versus time and distance versus time. It is easy for learners to misinterpret graphs of velocity, so have them...
EngageNY
Comparing Linear Functions and Graphs
How can you compare linear functions? The seventh installment of a 12-part module teaches learners how to compare linear functions whose representations are given in different ways. They use real-world functions and interpret features in...
Concord Consortium
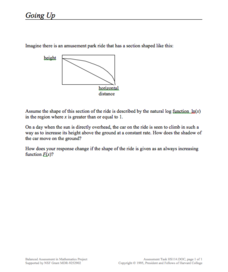
Going Up
Going on up—and up and up! An open-ended task asks learners to model the movement of an amusement ride with parametric equations. They then analyze their equations to determine how the shadow of the ride's car moves as it rises at a...
Curated OER
Heart Rate Monitoring
Algebra learners like this resource because it is easy to understand and it relates to their lives. Whether you are starting a new workout routine, or just climbing the stairs, your heart rate increases and decreases throughout the day....
Illustrative Mathematics
Walk-a-thon 1
Your mathematician's job is to explore the relationship between hours and miles walked during a walk-a-thon. The activity compels your learners to experiment with different means in finding out this proportional relationship. The answer...
Curated OER
Speed
Fifth and sixth graders practice working in pairs to determine whether they can walk with constant speed. They test themselves, collect their data, draw graphs with their data collected, manipulate the data, and then draw conclusions...
Curated OER
Gasoline Additive
Chemists consider a situation in which an ethanol producer needs to determine how much to add to t-butanol to prevent freezing during transport. They work in the laboratory to obtain the freezing point depression constant for the...
Curated OER
Rates and Slopes: An Astronomical Perspective
In this rates and slopes worksheet, students solve 2 problems where they find the rate corresponding to the speed of the galaxies in a Hubble diagram for galaxies and they calculate the rate of the sunspot number change between indicated...
Inside Mathematics
Squares and Circles
It's all about lines when going around. Pupils graph the relationship between the length of a side of a square and its perimeter. Class members explain the origin in context of the side length and perimeter. They compare the graph to the...
Balanced Assessment
On Averages and Curves
Determine the average on a curve. The class finds graphical representations of averages and expresses them both symbolically and on the graph. The assessment requires class members to justify using average to describe graphs.
Noyce Foundation
Lawn Mowing
This is how long we mow the lawn together. The assessment requires the class to work with combining ratios and proportional reasoning. Pupils determine the unit rate of mowers and calculate the time required to mow a lawn if they work...
Balanced Assessment
Ford and Ferrari
Which is faster, a Ford or a Ferrari? The short assessment has pupils analyze graphs to determine the rates of change between the two. Individuals interpret the rates of change within the context of speeds of the cars and develop a map...
Curated OER
Position vs. Time and Velocity vs. Time Graphs
In this constant velocity worksheet, young scholars use data of position vs. time of a roller-skater to determine speed, acceleration, or deceleration at different points along the path. Students rank graphs according to average velocity...
Noyce Foundation
Snail Pace
Slow and steady wins the race? In the assessment task, scholars calculate the rates at which different snails travel in order to find the fastest snail. Hopefully, your class will move much more quickly in finishing the task!
Curated OER
Understanding Distance, Speed, and Time Relationships
Students investigate distance, speed, and time relationships. In this distance, speed, and time relationships lesson, students simulate a runner using a computer program. Students adjust the starting point and speed of the runner and...
Curated OER
Slope as a rate of change
In this Algebra I/Algebra II activity, students examine the slope of line as the rate of change between the dependent and independent variables. The one page activity contains two multiple choice questions. Answers are included.
Curated OER
Lessen the Loan
Middle-schoolers explore the concept linear equations. They use the internet to navigate through videos and problems. Pupils problem solve to determine rates of change, slope, and x and y-intercepts.
EngageNY
The Computation of the Slope of a Non-Vertical Line
Determine the slope when the unit rate is difficult to see. The 17th part of a 33-part series presents a situation that calls for a method to calculate the slope for any two points. It provides examples when the slope is hard to...
Inside Mathematics
Swimming Pool
Swimming is more fun with quantities. The short assessment task encompasses finding the volume of a trapezoidal prism using an understanding of quantities. Individuals make a connection to the rate of which the pool is filled with a...


