Curated OER
Computer Careers Cube
Students use the internet to research the types of careers in technology. Using construction paper, they draw themselves in one or two of the careers they found interesting. To end the lesson plan, they share their drawings with the...
Curated OER
Computer Storage Worksheet
In this math worksheet, learners are given examples of different memory capabilities for the types of storage devices. They match the memory to the device for fifteen problems.
Texas Instruments
TI-Nspire™ CAS
When it comes to rating educational calculators, this calculator is always near the top of this list. Now it's available as an app. There is a lot of calculator power wrapped up in this app. Not only is this a fully functioning...
Computer Science Unplugged
Battleships—Searching Algorithms
How does a computer perform a search in order to find data? The lesson begins with a demonstration on finding one number out of 15. Pairs then play three games of Battleship by using different search techniques. The lesson...
Curated OER
Worksheet 7 Computer Lab
In this math worksheet, students program the computer to display a direction field plot for an equation. They plot several solutions on a graph.
Agriculture in the Classroom
A Holiday Tradition: Which Christmas Tree Will You Choose?
Different varieties of Christmas trees provide an interesting way to combine social studies, science, math, and technology. Class members not only research the history of the Christmas tree holiday tradition, they compare and...
Shodor Education Foundation
Algebra Quiz
Reviewing the process of solving equations is as easy as one click of a button. Scholars solve linear and quadratic equations by using a helpful interactive. The computer app automatically scores responses, providing immediate feedback...
Virginia Department of Education
Graphs
Examine different types of graphs as a means for analyzing data. Math scholars identify the type of graph from a series of data displays and then develop questions to match each one. Then, given a scatter plot of height versus age...
Balanced Assessment
Monitor Pricing
Out with the old and in with the new. Learners use a set of prices of computer monitors from 1994 to make a prediction. They then use one current price and what they know about the old prices to make a more recent prediction. Their...
National Security Agency
Classifying Triangles
Building on young mathematicians' prior knowledge of three-sided shapes, this lesson series explores the defining characteristics of different types of triangles. Starting with a shared reading of the children's book The Greedy...
Concord Consortium
Crossing the Axis
Mathematicians typically reference eight different types of functions. Scholars learn about the requirements for graphing a function and must decide how many different functions fit. To finish, they define each specific function meeting...
Children’s Hospital of Philadelphia
Discovery and Development of Vaccines
Stop the spread. Pupils work through two activities to gain an understanding of vaccines and immunity. Learners research different types of vaccines and how they are made and explore the advantages and disadvantages of them. Using a...
Under the Dome
Triangle Mystery ...
Build a pyramid based on sums. Individuals watch a video of a computer program that creates a pyramid of numbers based upon a starting number. The scholars develop a hypothesis on how the number trick works and share their thoughts on...
CK-12 Foundation
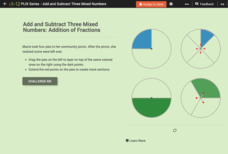
Addition of Fractions
Five word-problems challenge mathematicians to add fractions. Interactive fraction circles assist scholars in problem-solving. Question types include multiple-choice, true or false, and a discussion.
Curated OER
Worksheet 16 - Spring 1996
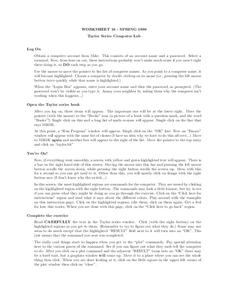
In this math worksheet, students read the instructions for setting up a computer program. Then they practice graphing the functions with the software program.
Curated OER
Implementing Algorithms Using Matlab
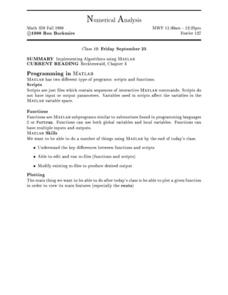
In this math worksheet, students practice implementing algorithms using the computer program of Matlab. They practice using the programs of scripts and functions.
Curated OER
Getting into Shape
Students identify 3-D geometric shapes through different pieces of artwork. They examine and identify segments and angles. Students act out shapes and create a piece of artwork. Additional cross curriculum activities are listed.
Curated OER
Types of Triangles
Fifth graders explore the required functions of the Geometer's Sketchpad. Using the computer software, they construct similar triangles and identify them by angles and sides. Students classify triangles. Afterward, they complete problems...
Curated OER
Great Graphing
Young scholars collect data, use a computer spreadsheet program to create various graphs, and compare the graphs. They state the findings of each graph in writing and decide which graph type best represents the data.
Curated OER
Computer Graphing
Young scholars research the Internet or create surveys to find graphable data. They collect, organize, analyze and interpret the data. Finally, they choose the appropriate type of graph to display the data and find the measures of...
CK-12 Foundation
Sums of Mixed Numbers: Split the Addition
Five questions challenge scholars to add mixed numbers. A tool creates a visual model that separates whole numbers from fractions parts. Problem types include fill in the blank, true or false, and discussion.
Curated OER
Dashboard of the Future
Students design dashboards for vehicles in 2020. After researching past and current trends in vehicle design, they sketch alternatives and select one to draw with computer-assisted design software (CAD), labeling all the components. With...
Curated OER
Create a Graph Online
Scholars create colorful bar, line, or pie graphs. They decide on a survey question to ask or a type of data to gather. From there, they collect information and data. They display this data in bar, line, or pie graphs that they create...
Curated OER
Correlation of Variables by Graphing
Middle and high schoolers use a spreadsheet to graph data. In this graphing lesson, learners determine how two parameters are correlated. They create a scatter plot graph using a computer spreadsheet.
Other popular searches
- "Typing" Computer
- Computer Typing Skills
- Basic Computer Typing Skills
- Computer Typing Lessons
- Computer Typing Lesson Plan
- Typing Computer
- Computer Typing Worksheets
