NOAA
Ground-truthing Satellite Imagery with Drifting Buoy Data
Ground-truthing ... is it even a word? The last installment of a five-part series analyzes how scientists collect sea surface temperature data. Scholars use government websites to compare temperature data collected directly from buoys...
National Wildlife Federation
Get Your Techno On
Desert regions are hotter for multiple reasons; the lack of vegetation causes the sun's heat to go straight into the surface and the lack of moisture means none of the heat is being transferred into evaporation. This concept, and other...
Howard Hughes Medical Institute
Measuring Biodiversity in Gorongosa
Take your biology class' understanding of biodiversity to a whole new level! Ecology scholars use data to calculate three different diversity indices based on the organisms in the Gorongosa National Park. The four-part activity uses an...
Curated OER
Graphing the Forecast-Line Graph or Bar Graph?
Students explore bar and line graphs. In this data collection, graphing, and weather lesson, students compare bar and line graphs and discuss which type of graph would be most appropriate for displaying a ten day weather forecast....
NOAA
Biological Oceanographic Investigations – Keep Away
As of 2015, there are 53,481 oil wells in the Gulf of Mexico. Scholars determine how species diversity is impacted based on the ecosystem's distance from a drilling platform. It focuses on finding the mean of data sets...
BioEd Online
Butterflies in Space
How does gravity affect the life cycle of a butterfly? Learn first-hand what types of investigations astronauts perform in space by following along with one of NASA's experiments. Create butterfly habitats in the classroom with specific...
Virginia Department of Education
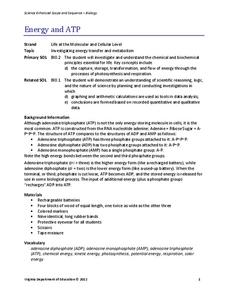
Energy and ATP
Take charge of your biology class by using this exciting analogy to relate the ATP process with batteries. Pupils use batteries and rubber bands to simulate the phosphate bonds between molecules in the body. They measure the distance in...
Laboratory for Atmospheric and Space Physics
Jupiter’s Relative Size
How do you properly illustrate the extreme size difference between two planets—Earth and Jupiter? With the help of jellybeans, of course! Create a scale model of Jupiter's mass compared to Earth using a fishbowl, 1,400 beans, and a...
Curated OER
How Does Your Garden Grow? Discovering How Weather Patterns Affect Natural Cycles
For the warm-up in this cool climate lesson, you will need to click on "Mapping" and then "US Mapping" once you arrive at NOAA's "US Climate at a Glance" page. Earth science explorers realize that 2012 was a warm winter for us. They read...
Curated OER
Exploring the USA and the World with Cartograms
Students investigate cartograms in order to explore the different countries on Earth. In this world geography lesson, students use the Internet to analyze data on different cartograms. Students compare data, such as population density,...
Laboratory for Atmospheric and Space Physics
The Planets and Scale
Scholars gain an insight into the relative size of planets and distance between inner and outer planets with the help of informational text, a data table, and a series of four questions.
Curated OER
FILLING IN THE GAPS - Acquiring and Analyzing Satellite and Ground-Based Data
Students monitor rainfall, compute daily averages, and compare their methods of computation to those used by actual researchers using satellite observations.
Curated OER
Is Grandpa Right, Were Winters Colder When He Was a Boy?
Students compare current weather data to historic data to see if there is a temperature change. In this weather lesson students complete a lab activity and determine average changes in temperature, precipitation and cloud cover.
University of Colorado
The Moons of Jupiter
Middle schoolers analyze given data on density and diameter of objects in space by graphing the data and then discussing their findings. This ninth installment of a 22-part series emphasizes the Galilean moons as compared to other...
Cornell University
Math Is Malleable?
Learn about polymers while playing with shrinky dinks. Young scholars create a shrinky dink design, bake it, and then record the area, volume, and thickness over time. They model the data using a graph and highlight the key features of...
Curated OER
Feeding in the Flow
The National Oceanic and Atmospheric Administration (NOAA) has developed a tremendous library of ocean-themed lessons that can be used in a variety of science settings. "Feeding in the Flow" is one of those activities; Its focus is on...
Curated OER
Osmosis and the Cell Membrane-part 2
Young scholars participate in a review of diffusion and the basic properties of the cell membrane before exploring the process of osmosis in a lab activity. Using shell-less eggs that have soaked in various solutions, students make...
University of Georgia
Heating and Cooling of Land Forms
Compare heating and cooling rates of different land forms. A lab activity has groups collect data on the rate of heating and cooling of soil, grass, saltwater, fresh water, and sand. An analysis of the rates shows how the different land...
Curated OER
How Can You Predict the Characteristics of an Unborn Baby?
Students compare three sets of unlabeled human chromosomes and gather related data, trace chromosomes to pair them, and make observations about them.
Curated OER
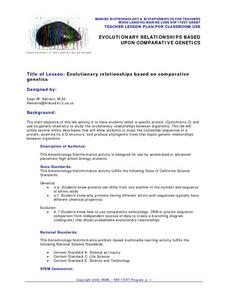
Evolutionary Relationships Based Upon Comparative Genetics
High schoolers investigate the protein cytochrome c in an attempt to use its genetic chemistry to study possible evolutionary relationships between organisms. The lesson integrates technology with the use computers to perform DNA analysis.
Curated OER
Graph and Compare the Adventure's Temperature Vs. Local Temperature
Learners explore the concept graphing data. In this graphing data lesson, students use weather data from their local weather and some other city and graph them. Learners plot the local weather vs. another city. Students record...
Nuffield Foundation
Effect of Size on Uptake by Diffusion
Cell size is limited by the surface area to volume ratio, but why is this true? Scholars measure the surface area and volume of cubes before placing them into liquid. After a set amount of time, they measure the uptake by diffusion for...
Serendip
The Molecular Biology of Mutations and Muscular Dystrophy
Different types of mutations cause unique types and degrees of muscular dystrophy. Scholars learn about the types of mutations and the impact on the body. They compare the location of the mutations and draw conclusions about how it is...
University of Wisconsin
Follow the Drop
Young surveyors look for patterns in water flow around campus. Using a map of the school (that you will need to create), they mark the direction of the path of water. They also perform calculations for the volume that becomes runoff. The...


