Education Development Center
Making Sense of Unusual Results
Collaboration is the key for this equation-solving lesson. Learners solve a multi-step linear equation that requires using the distributive property. Within collaborative groups, scholars discuss multiple methods and troubleshoot mistakes.
National Geographic
Measuring Elevation Past and Present
After viewing a short video about a climb up Mount Everest, high schoolers read about triangulation for measuring distant elevations. Have your class work in groups to construct an inclinometer and then use it to measure the height of...
Curated OER
Life is Full of Problems
Pupils use the problem solving strategy of guess and check to investigate math word problems. They determine which problem solving strategy or strategies would work best in problem situations.
EngageNY
TASC Transition Curriculum: Workshop 12
How can opinions slant facts? Workshop participants learn how to examine primary and secondary sources and identify the author's point of view. They also examine how visual art impacts the meaning and rhetoric of sources. Full of...
Teach Engineering
Balsa Glider Competition
Change one variable and try again. Teams build basic balsa gliders and collect data on their flight distances and times. Through collaboration, the team decides on two modifications to make to the basic design and collect data for the...
Curated OER
Representing Patterns & Evaluating Expressions
Write algebraic expressions, determine patterns, and evaluate expressions in a real-world context. Learners engage in a series of collaborative activities to identify, model, and give variables for real-world patterns. They write...
Ohio Department of Education
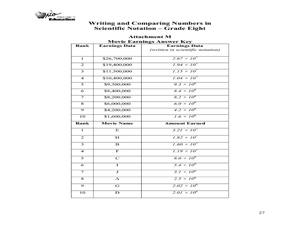
Writing and Comparing Numbers in Scientific Notation-Grade Eight
Explore scientific notation in this mathematics lesson. Young mathematicians explore multiple representations of large number in scientific notation through the use of models, visual representation and expanded form. The lesson provided...
Teach Engineering
Can You Resist This?
Some things are hard to resist. Small collaborative groups build circuits and calculate the voltage using Ohm's Law. Budding engineers explore the connection between the voltage across different resistors and linear...
Teach Engineering
Energy Systems
Is electricity created in the outlet? Using posters of several energy systems, collaborative groups identify and describe the parts of their systems. The groups also look at the environmental impacts of the systems and present...
Curated OER
Representing Data 2: Using Box Plots
What information can be gleaned from a box and whiskers plot? Discuss the five summary values - minimum, maximum, upper and lower quartiles, and median - and what conclusions can be made from these values? Included here is a matching...
Curated OER
House and Holmes: A Guide to Deductive and Inductive Reasoning
Test your pupils' reasoning skills with several activities and a quick mystery to solve. Learners watch and analyze a few video clips that demonstrate reasoning in action, practice deduction with an interactive and collaborative...
EngageNY
Arcs and Chords
You've investigated relationships between chords, radii, and diameters—now it's time for arcs. Learners investigate relationships between arcs and chords. Learners then prove that congruent chords have congruent arcs, congruent arcs have...
Teach Engineering
Who Can Make the Best Coordinate System?
Working with a map that does not have a coordinate system on it, small, collaborative teams must come up with a coordinate system for their map. Groups then explain their coordinate structure to the class.
Intel
Energy Innovations
Collaborative groups examine the importance of energy resources on quality of life by researching different energy sources and alternative energy sources through data analysis. They make a comparison of different countries and cultures,...
Intel
What Does This Graph Tell You?
What can math say about natural phenomena? The fifth STEM lesson in this project-based learning series asks collaborative groups to choose a phenomenon of interest and design an experiment to simulate the phenomenon. After collecting...
Curated OER
Rubber Band Banza
Third graders review ideas about sound and vibration to make their own stringed instrument. They review what a pictograph and bar graph are. Pupils conduct a survey within the classroom to choose the four favorite string instruments and...
Curated OER
CEENBoT Pictionary
Define and review math vocabulary. Use the CEENBoT to draw pictures that represent each vocabulary word. Pupils work in groups to play math pictionary.
Curated OER
"who Lives in Your House?"
Fourth graders collect data about the people and animals living in their homes, and the students' shoe sizes. They work in groups to enter the information into a database from which they create graphs. They analyze the data to find the...
Ohio Department of Education
I Can Name that Angle in One Measure! - Grade Eight
Collaborative groups work with geometry manipulatives to investigate conjectures about angles. They create a graphic organizer to use in summarizing relationships among angles in intersecting, perpendicular and parallel lines cut by a...
Curated OER
Quadrilateral Explorations
Ninth graders identify quadrilaterals and label the vertices of quadrilaterals. they justify their identification of the quadrilaterals. Students work in groups to identify and create quadrilaterals
Utah Education Network (UEN)
Order of Operations Treasure Hunt
In this algebra lesson, students work in groups to design a treasure map in which algebraic equations must be solved using the correct order of operations. Students decide where treasure is hidden, then create and follow their group's...
Curated OER
Probability in Daily Life
Sixth graders examine the use of probability in daily life. In this probability lesson plan, 6th graders listen to scenarios from Louis Sachar's, Holes, after discussing probability in everyday life. They pretend they are detectives who...
Curated OER
Drive the Data Derby
Three days of race car design and driving through the classroom while guessing probability could be a third graders dream. Learn to record car speed, distances traveled, and statistics by using calculation ranges using the mean, median,...
Statistics Education Web
Now You SeeIt, Now You Don't: Using SeeIt to Compare Stacked Dotplots to Boxplots
How does your data stack up? A hands-on activity asks pupils to collect a set of data by measuring their right-hand reach. Your classes then analyze their data using a free online software program and make conclusions as to the...

