National Wildlife Federation
The Tide is High, but I’m Holding On… Using ICESat Data to Investigate Sea Level Rise
Based on the rate of melting observed from 2003-2007 in Greenland, it would take less than 10 minutes to fill the Dallas Cowboys' Stadium. The 17th lesson in a series of 21 has scholars use the ICESat data to understand the ice mass...
Curated OER
Changing Planet: Sea Levels Rising
Begin by showing a six-minute video, Changing Planet: Rising Sea Level as an anticipatory set. Pupils draw a topographic map of a potato continent. Finally, they will visit NOAA's sea levels online map and NASA's carbon dioxide...
McAuliffe-Shepard Discovery Center
Global Warming in a Jar
This well-organized lab activity introduces earth science pupils to the greenhouse effect. They will set up two experiments to monitor temperatures in an open jar, a closed jar, and a closed jar containing water. Ideally, you would have...
Curated OER
Do You Have Change?
Learners analyze data and complete a worksheet about land use change in a coastal region. In this land use lesson, students discuss events that cause land use changes in coastal areas. They construct a change table to summarize data on...
Curated OER
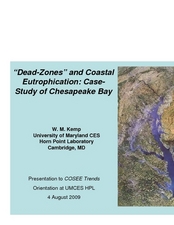
"Dead-Zones" and Coastal Eutrophication: Case-Study of Chesapeake Bay
Take an in-depth look at nutrient loading, eutrophication, and hypoxia using data on The Chesapeake Bay as an example. This comprehensive presentation includes detailed graphs, photos, and details about the changes in marine organism...
College Board
2003 AP® Environmental Science Free-Response Questions
One size fits all doesn't seem to be the right approach to endangered species. Using a four-part AP® assessment, learners respond to questions that address environmental concerns such as human population changes, invasive species...
NOAA
Ocean Acidification
Carbon dioxide is on the rise; does that also mean a rise in danger to humans and animals? Scholars learn what that means for the environment and more specifically the ocean. They examine data on the pH of different ocean areas and learn...
Curated OER
Sea Level Trends ~ Ocean Front Property: An "Immerging" Market
Young oceanographers take a look at sea level data from several cities over a few centuries. They use the data to fuel a discussion about what kind of changes are taking place and the impact they are having on the coastal ecosystems....
Space Awareness
Oceans on the Rise
Temperature rises and land disappears! Through a lab exploration, learners understand the effect of temperature increase on water similar to the effect of global warming on our oceans. As they heat the water in a flask, they measure the...
Curated OER
Using SWMP Data
Students are introduced to the SWMP system which tracks short-and long-term changes in water. Using this data, they plot and interpret the data on a graph to determine how human activities are lowering the water quality. They also...
Curated OER
Ghostbusting in the Chesapeake
Ghost pots, fishing gear lost during crabbing expeditions, continue to trap crabs that are never collected. Increase your budding ecologists' awareness of human impact on the environment as well as conservation efforts using this...
Curated OER
Ready, Set, Drift!
Pupils define data, recover data from the Internet, and use information they obtain to solve problems. In this investigative lesson students answer questions on a worksheet and demonstrate the use of a maneuvering board in solving...
Curated OER
Water in the Texas Coastal Basins
Students, after researching a Texas coastal basin, map and graph the information they collect and then translate it into a short report to be presented to their classmates. They brainstorm unique ways to maintain Texas estuaries as well...
Curated OER
The Tides of Change Worksheet (Part 1)
In this science worksheet, 1st graders track the tides of the ocean for a number of days and examine the data to determine the meaning of the pattern.
Curated OER
Conductivity - Pass the Buoy and Pepper, Please
Buoys around our coastlines are equipped with sensory devices which monitor temperature, salinity, and water pressure. Emerging earth scientists examine some of this data and relate salinity to the electrical conductivity of the surface...
Curated OER
Where's the Beach?
Students use beach profile data to analyze how erosion and sediment transport changed seashore slopes. In this geology lesson, students plot the data provided and analyze erosion patterns. They also assess coastal erosion management...
Curated OER
Upwelling - Cold One Day, Warm Another?
Discuss with your oceanographers what forces cause nearshore upwelling and downwelling. Display a line of wind vectors alongside a graph of the temperatures so that they can discover whether or not they are related. Discussion questions...
Curated OER
Coral Bleaching in the Caribbean
Students practice analyzing images, maps and graphs from Internet-based educational resources. They explore the correlation between sea surface temperature and coral bleaching. Students comprehend that coral reefs are collections of tiny...
Curated OER
Forces and Masses and Motion, Oh My!
Students explore how varying force and mass effect the motion of an object. In this motion lesson students participate in a class activity and demonstrations.
Curated OER
the Potential Consequences of Climate Variability And Change
Students analyze the consequences of changing variables on a system. Changes in a model are measured and recorded and conclusions drawn based on the data provided in this six lessons unit.
Curated OER
A Coastal Arctic Food Web
High schoolers create a food web of the arctic ecosystem. In this biology lesson plan, students explain how global warming affects this ecosystem. They explain how losing a species affects the entire community.
Curated OER
Coastal Ecology of the Bahamas
Sixth graders investigate the Bahamas through presentations and charts. For this ecology lesson, 6th graders utilize their library and Internet to research the life forms and species that inhabit the Bahamas. Students observe a...
Curated OER
Long Island Sound - A Research Skill Approach
Eighth graders examine the characteristic of Long Island Sound. In groups, they use the internet to describe how the Sound formed and what environmental changes have altered it. They also discover what humans have done to affect the...
Curated OER
What Happens When Sea Level Rises or Falls
Students examine the impact of sea level on land formations. In this geography and map activity, students construct a contour map model illustrating how much of the clay "coastline" is covered as water is added. Metric measurement is...


