Curated OER
Bar Graphs With Intervals
Give your math class a comprehensive understanding of bar graphs with this series of lessons. The resource is divided into three parts, and all of the accompanying worksheets are included. The class will study different bar graphs,...
Curated OER
Rhythm, Triads, Intervals
Let the class show what they know about rhythm, triads, and intervals with this quiz. They complete the rhythm on staff one and two, identify the intervals on staff three, and identify the triads on staff four. This is a well-thought-out...
Curated OER
Daily Class Schedule
Keeping track of each day's schedule can be a challenge, especially for kids who attend schools with block or modified block schedules. Never fear, help is here with a template that permits kids to log their daily class schedule.
Statistics Education Web
Walk the Line
How confident are you? Explore the meaning of a confidence interval using class collected data. Learners analyze data and follow the steps to determine a 95 percent confidence interval. They then interpret the meaning of the confidence...
Bowels Physics
Graphical Analysis
Assist your class in learning graphical analysis by reviewing the slide presentation. Class members review 15 slides to further understand concepts such as velocity and acceleration. They conclude with practice problems related to the...
Curated OER
Mapping
Introduce middle or high schoolers to topographic maps with this PowerPoint. After a review of longitude and latitude, display and describe contour lines and intervals. Also explain map scale. This is a useful presentation for a social...
Statistics Education Web
Did I Trap the Median?
One of the key questions in statistics is whether the results are good enough. Use an activity to help pupils understand the importance of sample size and the effect it has on variability. Groups collect their own sample data and compare...
EngageNY
Creating a Histogram
Display data over a larger interval. The fourth segment in a 22-part unit introduces histograms and plotting data within intervals to the class. Pupils create frequency tables with predefined intervals to build histograms. They describe...
West Contra Costa Unified School District
The Extreme Value Theorem
Finding the critical numbers of a function can be extreme. The activity introduces the Extreme Value Theorem to the class with a graph. Pupils then have an opportunity to practice determining the values using an algebraic function.
Statistics Education Web
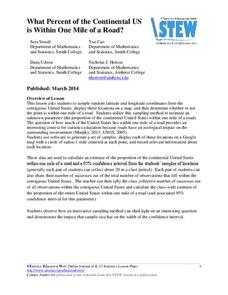
What Percent of the Continental US is Within One Mile of a Road?
There are places in the US where a road cannot be found for miles! The lesson asks learners to use random longitude and latitude coordinates within the US to collect data. They then determine the sample proportion and confidence interval...
CK-12 Foundation
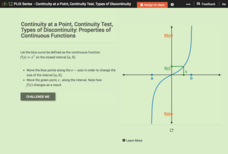
Continuity at a Point, Continuity Test, Types of Discontinuity: Properties of Continuous Functions
Take a closer look at continuous functions within given intervals. Using the parent cubic function, learners explore properties of continuous functions on intervals. Pupils interpret the Intermediate Value Theorem and the Extreme Value...
EngageNY
Interpreting the Graph of a Function
Groups sort through NASA data provided in a graphic to create a graph using uniform units and intervals. Individuals then make connections to the increasing, decreasing, and constant intervals of the graph and relate these connections...
CK-12 Foundation
Intermediate Value Theorem, Existence of Solutions: Function Exploration
Does the value exist? The interactive allows pupils to visualize the Intermediate Value Theorem. Using the visualization, individuals respond to questions using specific values and general values. The class comes to the conclusion what...
Curated OER
Telling Time
Young learners participate in activities which help them understand analog clocks, and the vocabulary of telling time. They examine the values of the intervals of minutes and hours by making a human clock.
Curated OER
Telling Time With Clocks/Bingo “Time”
Young learners create a clock by adding hands and placing the numbers in the correct location. After each learner has their very own clock, they explore each component. Review on the hour times, and then introduce them to five-minute...
West Contra Costa Unified School District
Using Derivatives to Graph Polynomials
You can learn to graph as well as a calculator using calculus. The lesson introduces using derivatives to find critical points needed to graph polynomials. Pupils learn to find local maximums and minimums and intervals of increase and...
Curated OER
Histograms and Bar Graphs
Students are introduced to histograms, bar graphs, and the concept of class interval. They use an activity and three discussions with supplemental exercises to help students explore how data can be graphically represented (and...
Curated OER
Central Tendency
In this central tendency instructional activity, 8th graders solve 10 different problems that include determining the mean, mode, and median of various situations. First, they prepare a frequency distribution with a class interval for...
Curated OER
Telling Time Bingo
Have your youngsters examine the difference between digital and analog clocks. Using They participate in a "Telling Time BINGO" game. Not only is this activity fun, but it provides the teacher with an opportunity to informally assess his...
Math Worksheets Land
Halloween Cartesian Art: Bat
Get the class batty over graphing. Young mathematicians plot ordered pairs in all quadrants of a Cartesian plane, and connect the points to create a bat.
EngageNY
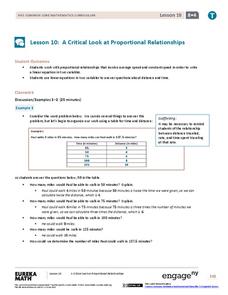
A Critical Look at Proportional Relationships
Use proportions to determine the travel distance in a given amount of time. The 10th installment in a series of 33 uses tables and descriptions to determine a person's constant speed. Using the constant speed, pupils write a linear...
Curated OER
Music Review Test
Wow this is a really thorough music quiz. There are a total of seven tasks for the class to complete. They must, write the C major scale, identify notes on the staff, write four major keys based on the information provided, identify...
Curated OER
Music Theory - Intervals
Pupils explore types of intervals containing major and minor sixths. While using Auralia computer software, they participate in a game to identify sharp and flat pitches. Afterwards, they identify the pitches by ear and listen to...
Radford University
“FUN-ctions” Find the Equation of a Scream
Take a function along for a ride. Given the graph of a roller coaster track, pupils determine key features of the graph such as the maximum, minimum, intervals of increase and decrease, and roots. They figure out the equation of the...


