Mathematics Vision Project
Module 8: Modeling Data
Statistics come front and center in this unit all about analyzing discrete data. Real-world situations yield data sets that the class then uses to tease out connections and conclusions. Beginning with the basic histogram and...
Beyond Benign
Can You Hear Me Now? Cell Phone Accounts
How sustainable are cell phones? Throughout the unit, learners explore the issues around cell phones concerning sustainability. Class members take a graphical look at the number of cell phones across the world using a box-and-whisker...
Radford University
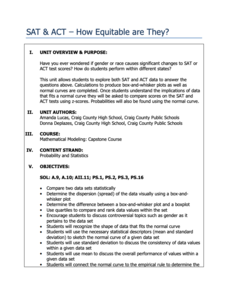
SAT and ACT – How Equitable Are They?
Test the test takers' knowledge of statistics about data from the SAT and ACT tests. Future collegians explore the idea of gender and racial bias in high-stakes college admissions exams. They analyze historical data on average scores by...
Mathematics Vision Project
Modeling Data
Is there a better way to display data to analyze it? Pupils represent data in a variety of ways using number lines, coordinate graphs, and tables. They determine that certain displays work with different types of data and use...
Curated OER
Describing Data
Your learners will practice many ways of describing data using coordinate algebra in this unit written to address many Common Core State Standards. Simple examples of different ways to organize data are shared and then practice problems...
Beyond Benign
Water Bottle Unit
How much plastic do manufacturers use to create water bottles each year? The class explores the number of water bottles used throughout the years to determine how many consumers will use in the future. Class members compare different...
Radford University
Danger! – An Analysis of the Death Toll of Natural Disasters
Decipher the danger of natural disasters. Using researched data, scholars work in groups to create data displays on the number of deaths from different types of natural disasters. They share their graphical representations with the class...
Radford University
Marketing Mayhem: Advertising for Adolescents
You'll be sold on using the resource. Future consumers first conduct a sample survey on marketing strategies. They then consider how mass media influences their age groups and create presentations to display their findings.
Simon & Schuster
Classroom Activities for The Call of the Wild by Jack London
Three activities are designed for readers of Jack London's The Call of the Wild. First, class members research and create posters that reflect the setting of the novel. Next, groups create posters with images that represent each chapter...
CK-12 Foundation
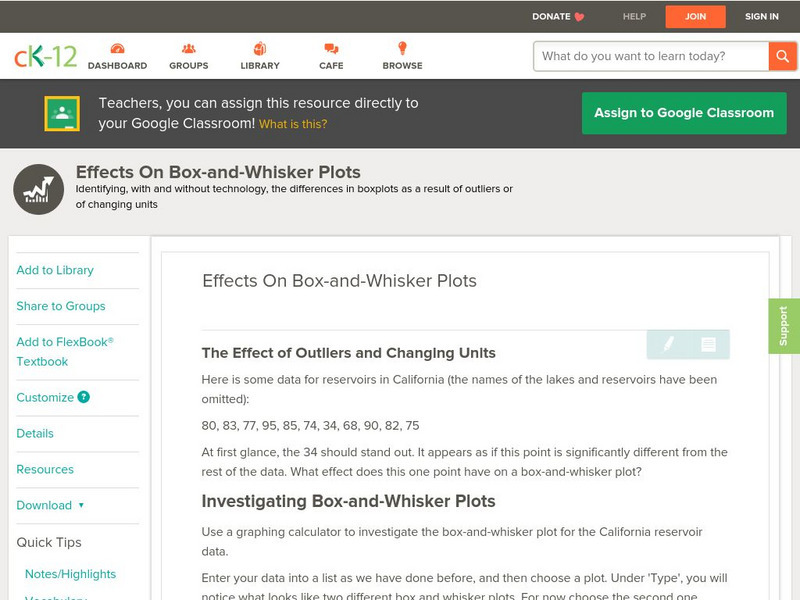
Ck 12: Statistics: Effects on Box and Whisker Plots
[Free Registration/Login may be required to access all resource tools.] This Concept covers the effects of outliers and a change in units on box-and-whisker plots.
CK-12 Foundation
Ck 12: Statistics: Box and Whisker Plots Grade 8
[Free Registration/Login may be required to access all resource tools.] Make Box-and-Whisker Plots to represent data.
CK-12 Foundation
Ck 12: Statistics: Box and Whisker Plots Grades 8 9
[Free Registration/Login may be required to access all resource tools.] Learn how to use box-and-whisker plots to analyze data.
CK-12 Foundation
Ck 12: Statistics: Box and Whisker Plots Grade 7
[Free Registration/Login may be required to access all resource tools.] Draw and use box-and-whisker plots to display and organize data.
CK-12 Foundation
Ck 12: Statistics: Double Box and Whisker Plots Grades 9 10
[Free Registration/Login may be required to access all resource tools.] Construct and use double box-and-whisker plots.
CK-12 Foundation
Ck 12: Statistics: Box and Whisker Plots Grades 9 10
[Free Registration/Login may be required to access all resource tools.] Make and interpret a box-and-whisker plot for a set of data.
CK-12 Foundation
Ck 12: Applications of Box and Whisker Plots Grades 9 10
[Free Registration/Login may be required to access all resource tools.] Use calculators to create box-and-whisker plots.
CK-12 Foundation
Ck 12: Statistics: Applications of Box and Whisker Plots Grade 8
[Free Registration/Login may be required to access all resource tools.] Using box-and-whisker plots to understand and interpret data.
CK-12 Foundation
Ck 12: Statistics: Box and Whisker Plots Grades 11 12
[Free Registration/Login may be required to access all resource tools.] This Concept teaches students how to use the five-number summary to make a box-and-whisker plot.
CK-12 Foundation
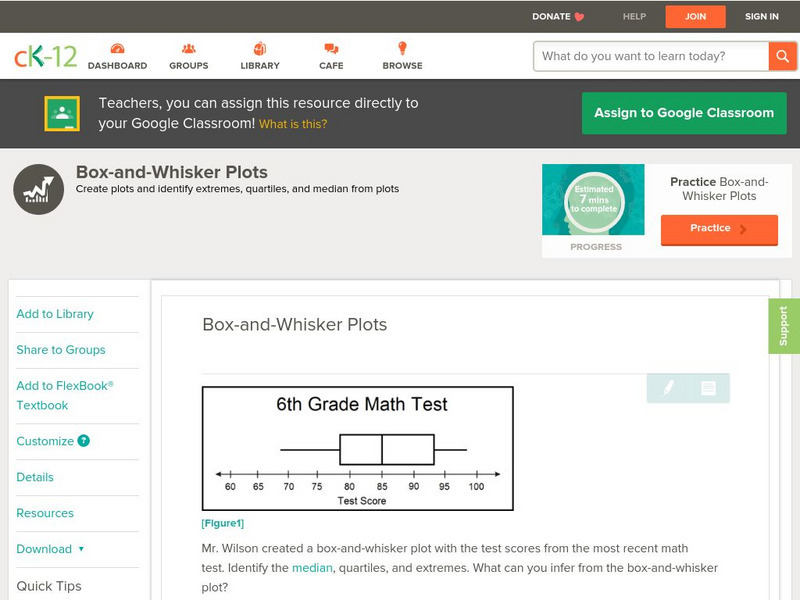
Ck 12: Statistics: Box and Whisker Plots Grade 6
[Free Registration/Login may be required to access all resource tools.] Draw and analyze a box-and-whisker plot.
Sophia Learning
Sophia: Box and Whisker Plots
Explore how to display data using a box and whisker plot.
Shmoop University
Shmoop: Basic Statistics & Probability: Box & Whisker Plots
Students learn about box and whisker plots. Notes, examples, and practice exercises are included in the statistics resource.
Sophia Learning
Sophia: Representing With Box and Whisker Plots: Lesson 1
This lesson demonstrates how a box-and-whisker plot can be used to represent data. It is 1 of 3 in the series titled "Representing with Box-and-Whisker Plots."
Oswego City School District
Regents Exam Prep Center: Displaying Data
Use this lesson, practice exercise, and teacher resource in planning instruction on displaying data. In the lessons, you'll find definitions and examples of ways to collect and organize data, quartiles, and box-and-whisker plots, as well...
CK-12 Foundation
Ck 12: Statistics: Quartiles
[Free Registration/Login may be required to access all resource tools.] Order a set of data and understand the measures needed for a box-and-whisker plot.


