Curated OER
Bar Graphs and Pictographs
How are bar graphs and pictographs different? As you begin this concept, use these simple graphs to help get learners started with data analysis styles. There is one bar graph and one pictograph, each accompanied by four or five...
National Security Agency
Going Green with Graphs
In this unit designed for second graders, youngsters are introduced to conducting surveys and creating tally charts based on the data they gather. Students then construct bar graphs, and observe the relationships between the two...
Curated OER
Using Graphs
Print and use this useful unit on basic algebraic functions, domain, range, and graphing. Tasks include, illustrating simple functions with a graph, and identifying the domain and range of the function. This twelve-page packet contains...
Curated OER
Halloween Point Plot
Practice graphing and plotting points with a festive Halloween flair! Scholars plot 21 points on a grid, connecting them to create a spooky shape!
Baylor College
Air: The Math Link
Inflate this unit on the science of air with these math skills practice and word problems. Accompanying the children's story Mr. Slaptail's Secret, this resource covers a wide range of math topics including the four basic...
Balanced Assessment
Telephone Service
Class members must determine the best phone plan for customers. by assessing three different phone plans. Each plan price depends not only the number of minutes, but also the location of the calls — bringing in a third variable. Scholars...
Curated OER
Making a Line Graph
In this line graph worksheet, students use data given in a table and assign axes, make a scale, plot data and make a line or curve on their constructed graphs.
Curated OER
Economics Study Guide
Use this resource as a basic review of economic principles. There are six questions relating to the factors of production, opportunity costs, wants and needs, tangibles and intangibles, and more.
Curated OER
Systems of Equations and Inequalities
This is a comprehensive lesson on creating and solving equations and systems of equations and inequalities. Problems range from basic linear equations to more complex systems of equations and inequalities based on a real-world examples....
Curated OER
Sunshine Math-1
In this math skills worksheet, students answer 7 questions in which they use various basic math skills. They use number lines, charts, number blocks, a calendar and a ruler to complete this worksheet.
Curated OER
Reading Graphs
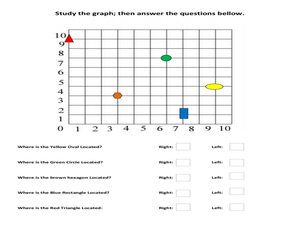
In this reading graphs practice worksheet, students examine a graph and respond to 5 questions that require them to record the coordinates of 5 shapes on the gridded graph.
Curated OER
Parallel and Perpendicular Lines
Young geometers get some solid skills practice in evaluating slopes. Beginning with the basics of slope through two points and progressing through properties of parallel and perpendicular lines, the building of skills is gradual and...
Learner
Solid Shapes
A collection of two lessons, kindergartners will identify two-dimensional shapes in solid shapes. They will develop basic knowledge of the components that make up a sphere, rectangular prism, pyramid, cylinder, cone, and cube. Young...
Virginia Department of Education
Give or Take a Few
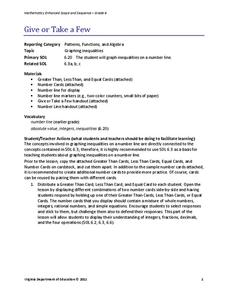
Young mathematicians extend their knowledge of rational numbers on a number line to graph inequalities by first using number cards to compare rational numbers. They finish by using similar reasoning to graph inequalities on a number line.
Mathematics Assessment Project
Arithmetic with Polynomials and Rational Expressions
It all starts with arithmetic. An educational resource provides four items to use in summative assessments. The items reflect the basic skill level required by the standards in the domain and are designed to have...
Curated OER
Morning Math / Homework Math
In this math worksheet, students complete ten exercises reviewing basic math skills related to place value, money, time, number sense, and graphing. A Homework Math sheet is also included reviewing the same skills.
Curated OER
Graph Study
In this geometry skills worksheet, students examine a graph and respond to 5 questions that require them to identify the coordinate pairs of object on the grid.
Curated OER
Human Coordinate Plane: Student Worksheet
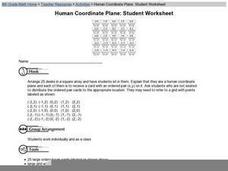
An excellent way to teach the basics of coordinate graphing is here for you! Young mathematicians take on the identity of one of the two numbers in a coordinate pair, and the entire class must arrange themselves in the proper order. This...
Curated OER
Conversation Starters
In this basic present simple verbs worksheet, 1st graders, working in teams of two or four, ask a set of questions in order to complete a graph on a variety of information to fill in a type of "information gap" chart.
Los Angeles County Office of Education
Assessment for the California Mathematics Standards Grade 5
Test young mathematicians' knowledge with an assessment aligned to California's fifth grade state standards. The exam covers a multitude of concepts including fractions and decimals, positive and negative numbers, measurement; and...
Willow Tree
Line Plots
You can't see patterns in a jumble of numbers ... so organize them! Learners take a set of data and use a line plot to organize the numbers. From the line plot, they find minimum, maximum, mean, and make other conclusions about the...
School Mathematics Project
Resource Sheets
This extensive and far-reaching collection of worksheets puts a new twist on many basic concepts. Learners use multiplication to trace a path from one point to another, tile a plane by converting between improper and proper fractions,...
Texas State Energy Conservation Office
Investigation: Gas Laws in Action - Propane
Using helium as an example of propane, physical science middle schoolers experiment with and graph the relationship between temperature and volume in gases. In a whole-class demonstration, they show how molecules behave under different...
Code.org
Good and Bad Data Visualizations
Good versus bad data. Pairs rate online collections of data representations from good to bad and then suggest ways to improve the visualizations. The class then creates a list of best practices and common errors in data representations...


