Mr. E. Science
Motion
An informative presentation covers motion, metric system, conversions, graphing of coordinates and lines, speed, velocity, and acceleration problems, as well as mean calculations. This is the first lesson in a 26-part series.
Science Geek
Electrons in Atoms
Electrons could never be Bohring! The presentation covers where you find electrons in an atom. It begins with the Bohr Model, then moves on to the Heisenberg Principle and orbital shapes. It concludes with the concept of electron spin...
Virginia Department of Education
Graphing Linear Equations
Combine linear equations and a little creativity to produce a work of art. Math scholars create a design as they graph a list of linear equations. Their project results in a stained glass window pattern that they color.
NOAA
The Oceanographic Yo-yo
How does chemistry help deep-sea explorers? Part four of a five-part series of lessons from aboard the Okeanos Explorer introduces middle school scientists to technologies used in ocean exploration. Groups work together to analyze data...
California Education Partners
Science Fair Project
Plant the data firmly on the graph. Given information about the growth rate of plants, pupils determine the heights at specific times and graph the data. Using the information, scholars determine whether a statement is true and support...
Curated OER
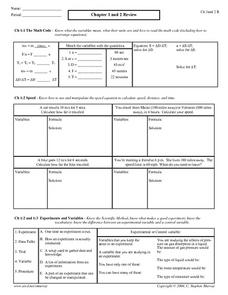
Chapter 1 and 2 Review
In this physics review worksheet, students complete 24 matching and problem solving questions pertaining to math code, speed, experiments and variables, slope, and acceleration and average speed.
Pennsylvania Department of Education
The Multiplicative Identity and Numbers Close to One
Pupils practice multiplying and dividing whole numbers by fractions. They study the multiplicative identity property that states that the product of any number and 1 is that number. They multiply whole numbers by fractions close to 1 and...
Pennsylvania Department of Education
Problem Solving with Fractions
Solve story problems using fractions or decimals. Then, determine the reasonableness of answers using estimation.The detailed lesson includes essential questions, vocabulary, a materials list, and links to related units.
Curated OER
How to Draw a Bar Chart Correctly
Your class has gathered their data, so what's the next step? They need to display and analyze their data, and a bar chart is a perfect tool for the job. This resource provides the step-by-step instructions those kids need to construct a...
Curated OER
Graphing X, Y, Z
Seventh graders explore how proportion controls the image of a drawing. They examine a coordinate plane and discuss plotting. Student experiment drawing an object one size, and then drawing an identical object on a different scale.
Curated OER
How Big Is Your Head?
Students explore measurement by measuring classmates' heads. They record their measurements and they put the measurements in order from smallest to largest. Students figure the mean, median, mode, maximum, minimum, and range of their...
Curated OER
Worksheet 7 - Derivative
For this derivative worksheet, students derive the equation of a plane containing given points. This one-page worksheet contains eight multi-step problems.
Curated OER
Usage and Interpretation of Graphs
Cooperative groups are formed for this graphing activity. Each group must construct a graph that represents how many eyelets (the holes for laces in shoes), are present in their group. A whole-class bar graph is eventually constructed...
Curated OER
Double Bar Graphs - Homework 7.1
Your learners have seen basic bar graphs, but do they have experience reading double bar graphs? This learning exercise details how to draw a double bar graph and provides an example with six accompanying questions. The final question...
Curated OER
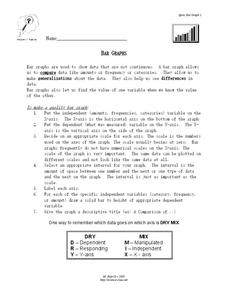
Bar Graphs
In this bar graph worksheet, students read about making quality bar graphs and they make a bar graph using given data. They answer 5 questions about their graph.
Curated OER
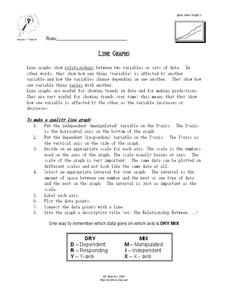
Line Graphs
In this algebra worksheet, students describe the relationship between a line graph and its data. They define the reasons line graphs are used and discuss increasing and decreasing lines. There is one involved questions, requiring several...
Curated OER
Scatter Plots
For this Algebra I/Geometry/Algebra II worksheet, students create a scatter plot and analyze the data to determine if the data show any type of correlation. The four page worksheet provides extensive explanation of topic, step-by-step...
Curated OER
Olympic Bar Graphs
In this Olympic bar graph worksheet, students pick a sport from the 2004 Olympic games and find data from the Olympic web page. They graph the scores (times, distance, or speed) and the medals. They answer questions about the variables...
Curated OER
Coordinates
In this geometry instructional activity, 10th graders are given points on a coordinate plane, and they must figure out what the x and y values are. There are 6 graphing question.
Curated OER
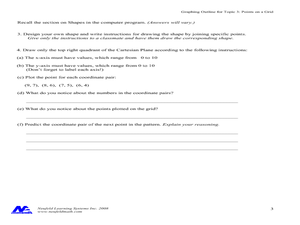
Concept: Points on a Grid
In this coordinate grid graphing worksheet, students play a game of Battleship on the computer. They answer 21 questions about the coordinate grid and graphing.
Curated OER
Mapping the Ocean Floor
Students construct and interpret a line graph of ocean floor depth and a bar graph comparing the height/depth of several well-known natural and man-made objects and places. In addition, they calculate the depth of two points using sonar...
Curated OER
Comparison of Images Formed by Plane, Cylindrical and Spherical Mirrors
Young scholars experiment with differently shaped mirrors. In this reflection and optics instructional activity, students investigate the visual effects of reflected images in mirrors. They use plane, cylindrical, and concave mirrors for...
Curated OER
Linear Equations in Our Every Day World!
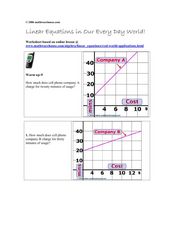
In this linear equations worksheet, students read and interpret graphed linear equations. They read a story problem, write a linear equation, and plot the points on a coordinate plane. This five-page worksheet cotnains 12 problems.
Pennsylvania Department of Education
Using the Coordinate Plane in Problem Solving
Fifth graders practice solving problems. In this fraction and decimal lesson plan, 5th graders recognize the relationship between fraction and decimals. Students estimate problem results and write expressions to use for problem solving.


