EngageNY
Are All Parabolas Similar?
Congruence and similarity apply to functions as well as polygons. Learners examine the effects of transformations on the shape of parabolas. They determine the transformation(s) that produce similar and congruent functions.
EngageNY
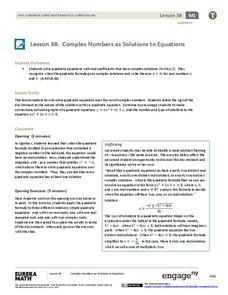
Complex Numbers as Solutions to Equations
Quadratic solutions come in all shapes and sizes, so help your classes find the right one! Learners use the quadratic formula to find solutions for quadratic equations. Solutions vary from one, two, and complex.
EngageNY
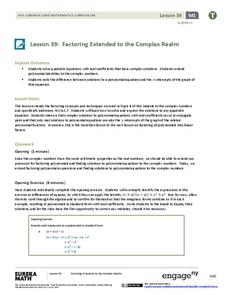
Factoring Extended to the Complex Realm
A solution will work one way or another: find solutions, or use solutions to find the function. Learners use polynomial identities to factor polynomials with complex solutions. They then use solutions and the Zero Product Property to...
EngageNY
Analyzing a Verbal Description
What function will describe the insect population growth? Pairs or small groups work together to determine which type of function and specific function will model given scenarios. The scenarios differentiate between linear, exponential...
EngageNY
Modeling a Context from a Verbal Description (part 1)
When complicated algebraic expressions are involved, it is sometimes easier to use a table or graph to model a context. The exercises in this lesson plan are designed for business applications and require complex algebraic expressions.
EngageNY
The Height and Co-Height Functions of a Ferris Wheel
Show learners the power of mathematics as they model real-life designs. Pupils graph a periodic function by comparing the degree of rotation to the height of a ferris wheel.
EngageNY
Extending the Domain of Sine and Cosine to All Real Numbers
Round and round we go! Pupils use reference angles to evaluate common sine and cosine values of angles greater than 360 degrees. Once they have mastered the reference angle, learners repeat the process with negative angles.
EngageNY
Why Call It Tangent?
Discover the relationship between tangent lines and the tangent function. Class members develop the idea of the tangent function using the unit circle. They create tables of values and explore the domain, range, and end behavior of the...
West Contra Costa Unified School District
Solving Inequalities
What does translating points on a number line have to do with solving inequalities? Young mathematicians first learn about translations of points on a number line, and then use this information to solve linear inequalities in one variable.
West Contra Costa Unified School District
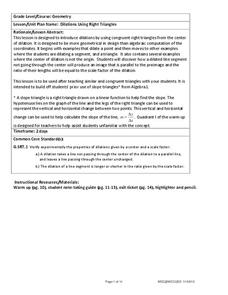
Dilations Using Right Triangles
Don't argue with a triangle that has a 90-degree angle. It's always right. Scholars first use right triangles to help draw dilations of points. They continue the lesson by applying this skill to draw dilations of polygons.
West Contra Costa Unified School District
Graphing Family of Functions
Functions have families, too. Learners first graph the parent functions for linear, quadratic, and cubic functions, and then use vertical translations to graph families of functions.
West Contra Costa Unified School District
Lowest Common Multiple through the Grades
The LCM will be your new BFF. Learners review least common multiple and least common denominator applications, mostly on fractions, from middle school. Scholars then see how the LCM can be applied to various types of problems from...
EngageNY
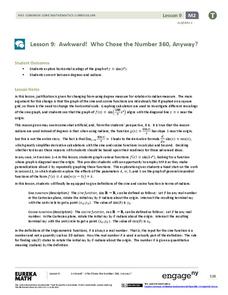
Awkward! Who Chose the Number 360, Anyway?
Don't give your classes the third degree. Use radians instead! While working with degrees, learners find that they are not efficient and explore radians as an alternative. They convert between the two measures and use radians with the...
EngageNY
Ferris Wheels—Using Trigonometric Functions to Model Cyclical Behavior
Have class members going in circles as they model the path of a Ferris Wheel using trigonometric functions. Building on the previous lesson in this series on transformations, learners use trigonometric functions to model wheels of...
EngageNY
Calculating Conditional Probabilities and Evaluating Independence Using Two-Way Tables (part 1)
Being a statistician means never having to say you're certain! Learners develop two-way frequency tables and calculate conditional and independent probabilities. They understand probability as a method of making a prediction.
EngageNY
Margin of Error When Estimating a Population Mean (part 2)
Don't leave your classes vulnerable in their calculations! Help them understand the importance of calculating a margin of error to represent the variability in their sample mean.
EngageNY
Sampling Variability in the Sample Mean (part 2)
Reduce variability for more accurate statistics. Through simulation, learners examine sample data and calculate a sample mean. They understand that increasing the number of samples creates results that are more representative of the...
EngageNY
Ruling Out Chance (part 3)
Pupils analyze group data to identify significant differences. They use simulation to create their own random assignment data for comparison.
EngageNY
Evaluating Reports Based on Data from an Experiment
They say you can interpret statistics to say what you want them to. Teach your classes to recognize valid experimental results! Pupils analyze experiments and identify flaws in design or statistics.
NOAA
Ocean Layers I
How is it possible for ocean water to have layers? The sixth installment of a 23-part NOAA Enrichment in Marine sciences and Oceanography (NEMO) program investigates factors that cause different water densities to occur. Experiments...
Centers for Disease Control and Prevention
Microbe Multiplication Magic
A instructional activity introduces the reproduction rate of E. coli though a video. Then scholars complete a data table and graph of reproduction rates in ideal conditions as well as less than ideal conditions.
Statistics Education Web
Now You SeeIt, Now You Don't: Using SeeIt to Compare Stacked Dotplots to Boxplots
How does your data stack up? A hands-on activity asks pupils to collect a set of data by measuring their right-hand reach. Your classes then analyze their data using a free online software program and make conclusions as to the...
Statistics Education Web
First Day Statistics Activity—Grouping Qualitative Data
Making groups of groups can help to organize data. Classes use statistics to group themselves using descriptive adjectives. The objective is for learners to understand that grouping qualitative data is useful when the original groups are...
Personal Genetics Education Project
Scientific Themes in Personal Genetics
Humans can be tested for the presence of the BRCA gene, whose presence is an indicator that they have a greater chance of acquiring breast cancer than someone without the gene. Viewers have an opportunity to explore how genes and...
Other popular searches
- Cell Structures Answer Key
- Factor Trees Answer Keys
- Analogies With Answer Key
- Activity 1.3.2 Answer Key
- Logistic Growth Answer Key
- Activity 132 Answer Key
- Egg Cell Answer Key
- Fractions With Answer Key
- Factoring Algebra Answer Key
- Multiplication Answer Key
- Study Links Answer Key
- Metric Mania Answer Key


