Omaha Zoo
I Like to Move It
What do lemurs do best? They move! Lemurs like to jump, run, hop, and climb and it's your class's job to document seven fun lemur behaviors. The class starts by discussing why lemurs are considered primates, and then they isolate seven...
Curated OER
Graphing and Analyzing Biome Data
Students explore biome data. In this world geography and weather data analysis lesson, students record data about weather conditions in North Carolina, Las Vegas, and Brazil. Students convert Fahrenheit degrees to Celsius degrees and use...
Teach Engineering
Where Are the Plastics Near Me? (Mapping the Data)
The last activity in a nine-part series has teams create a Google Earth map using the data they collected during a field trip. Using the map, groups analyze the results and make adjustments to the map to reflect their analysis. A short...
Howard Hughes Medical Institute
Scientific Inquiry Using WildCam Gorongosa
How do scientists determine what questions to ask to meet their research goals? Help your class develop an inquiry mindset with a lesson based on studies in the Gorongosa National Park. Partners create their own research questions by...
Curated OER
Data and Scientific Graphs
Learners conduct experiments and graph their data. In this statistics lesson, students collect data and graph it on a coordinate plane. They analyze the data looking for patterns and they discuss their findings with the class.
NASA
A Different Perspective
What can we learn from the data? Young scholars analyze actual solar data to answer specific questions. The activity presents an opportunity for an open-ended investigation of the data to conclude a five-part series on solar winds.
Curated OER
Dot Plots
Number crunching statisticians explore displaying data with dot plots and define the difference between quantitative data and qualitative data. Dot plots are created based on a set of given data and analyzed.
NASA
Developing an Investigation
Watch as your class makes the transition from pupils to researchers! A well-designed lesson has scholars pick a solar wind characteristic to research. They then collect and analyze official data from the LANL website. This is the...
Curated OER
Ornithology and Real World Science
Double click that mouse because you just found an amazing instructional activity! This cross-curricular Ornithology instructional activity incorporates literature, writing, reading informational text, data collection, scientific inquiry,...
Curated OER
Weather, Data, Graphs and Maps
Students collect data on the weather, graph and analyze it. In this algebra lesson plan, students interpret maps and are able to better plan their days based on the weather reading. They make predictions based on the type of clouds they...
Curated OER
Multi-dimensional Modeling of Ore Bodies Making Sense of Empirical Data
Math scholars identify four different rock types in that strata and use this identification and data to construct a two dimensional geologic cross-section. They use data tables to construct a three-dimensional geologic cross-section.
Curated OER
Analyzing Meteorological Data From Mars
High schoolers compare real-time Earth and Mars measurements for temperature, wind speed, humidity and atmospheric pressure by accessing Internet-data resources from NASA. They access real-time weather data and maps for their school...
Curated OER
Frost Depth Study
Students complete activities to study the frost and frost depth. In this frost study lesson, students use frost tubes to study and measure the frost at their school. Students measure the frost in the tube and enter their data online to...
Curated OER
Download and Analyze
Students download information from a NASA website into a database. They transfer it to a spreadsheet by completing the information and analyze the information. They determine temperature averages, mode, and graph the results. They write...
Intel
Energy Innovations
Collaborative groups examine the importance of energy resources on quality of life by researching different energy sources and alternative energy sources through data analysis. They make a comparison of different countries and cultures,...
Ohio Department of Education
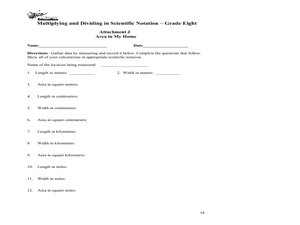
Multiplying and Dividing in Scientific Notation - Grade 8
Here is really nice set of resources on scientific notation. Eighth and ninth graders explore the concept of multiplying and dividing in scientific notation. In this multiplying and dividing numbers in scientific notation...
Curated OER
NIGHT AND DAY: DAILY CYCLES IN SOLAR RADIATION
Students examine how Earth's rotation causes daily cycles in solar energy using a microset of satellite data to investigate the Earth's daily radiation budget and locating map locations using latitude and longitude coordinates.
Discovery Education
Fuss About Dust
Dust is everywhere around us; it's unavoidable. But what exactly is dust and are certain locations dustier than others? These are the questions students try to answer in an interesting scientific investigation. Working independently or...
Radford University
Sleep and Teen Obesity: Is there a Correlation?
Does the number of calories you eat affect the total time you sleep? Young mathematicians tackle this question by collecting their own data and making comparisons between others in the class through building scatter plots and regression...
Curated OER
Interpreting Oceans of Data
Sixth graders analyze the data from a scientific experiment. In this statistics lesson, 6th graders answer questions about some data to show their understanding of the data. They apply the result to future decisions when using data.
Curated OER
Bird Ecology Unit
Tenth graders conduct various activities utilizing the scientific method to formulate a hypothesis, conduct a controlled experiment, collect and analyze the data and communicate their results through a poster. They also identify...
Learning Games Lab
Scientific Graph Reading
Interpreting graphs is an essential skill for young scientists. An interactive online lesson gives individuals an opportunity to review the components of a graph and learn to read and interpret the shape of a graph. The lesson includes...
Curated OER
How High Are the Clouds?
Young scholars analyze height and collect data to create a graph. In this statistics lesson, students use central tendencies to analyze their data and make predictions. They apply concept of statistics to other areas of academics to make...
Curated OER
Climate Systems - Which Location Is Best For Me?
Students study the difference between weather and climate. In this climate systems lesson plan students search the Internet for the parts of the Earth's system, gather climate data and complete a challenge scenario.


