Curated OER
Externalities Worksheets
Explore economics with this resource on externalities, supply and demand, and third party costs. Learners answer questions, provide examples, analyze and change graphs, and make predictions about the impact of variables.
Curated OER
Custom Line Plot Worksheets
Do you need to create custom line plot worksheets for your math learners? Use this template to create the line plot. Include up to five questions below the plot.
Curated OER
Identifying Ozone Variations over Different Locations
Learners analyze ozone data. In this atmosphere lesson, students will use a NASA resource to gather data for different regions of the Earth. Learners will then create a graph for their data and answer related questions.
Council for Economic Education
A Lesson on the Supply and Demand of Toy Fads
Let's all Hula Hoop! Scholars research the supply and demand side of toy fads in the United States. They analyze video clips and news articles to complete graphs on how the supply curve slope works in concert with the demand for products...
Curated OER
Feeling the Heat
Pupils record temperatures at different locations around campus. They examine the results and draw conclusions about how materials and colors affect the amount of heat produced. They also analyze Los Angeles' temperature records over a...
Curated OER
Polar Bears in Peril - Climate Change Culprit?
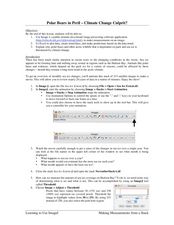
High schoolers explore the changes in sea ice over several years. In this life science lesson, students review and examine 20 years of data. They use Excel to graph data and analyze trends.
Teach Engineering
Penny Perfect Properties (Solid-Liquid Interations)
I can get more water to stay on a penny than you can! Collaborative pairs determine the volume of liquids that can be contained on the surface of copper pennies and plastic coins. The pairs analyze their results using graphs and go on to...
American Statistical Association
Speedster
Catch me if you can. Scholars collect data on reaction time by catching a falling ruler or by using an Internet app. They determine the median of the data, create graphs, and analyze the results. They also compare their data to the rest...
Texas State Energy Conservation Office
Investigation: Building a Parabolic-Trough Collector
Amateurs of alternative energy build a mini parabolic-trough solar energy collector and use it to heat water. Temperature is recorded over a three-minute period and the data is graphed and analyzed. Note that in order to paint aquarium...
Mathematics Vision Project
Modeling Data
Is there a better way to display data to analyze it? Pupils represent data in a variety of ways using number lines, coordinate graphs, and tables. They determine that certain displays work with different types of data and use two-way...
Concord Consortium
Double Pendulum
What's better than a pendulum for studying motion and periods? A double pendulum! Young physical scientists use an interactive to explore pendulum motion—times two. The resource boasts a host of parameters to change and a running graph...
National Nanotechnology Infrastructure Network
Lab 2: Nanocatalysts Clean Your Car Emissions
Surface area certainly surfaces as a variable for chemical reaction rates. Scholars perform an experiment to discover how the size of catalysts affect the rate of a chemical reaction. They record their results in tables and graphs to...
NASA
Connecting Models and Critical Questions
Scholars use data to analyze and determine which sets of information need to be counted. They create a model to explain differences among chemical elements using graphs to prove concept mastery.
Physics Classroom
Component Addition
Learn to analyze vector addition on graph paper through multiple levels of practice problems. Pupils begin with two component addition and move through three and four components to prove mastery as one part of a series on vectors and...
Teach Engineering
Exploring Variables While Testing and Improving Mint-Mobiles (for High School)
Mint candies are good for more than just one's breath. Using basic materials such as mint candies, straws, index cards, and Popsicle sticks, scholars create race cars that meet a given budget as well as design constraints. They perform...
Flipped Math
Calculus AB/BC - Estimating Limit Values from Tables
There's value in using a video to analyze a table of values. Pupils learn how to find the limit of a function from a table of values in the fourth of 18 lessons in Unit 1 - Limits and Continuity. An engaging video gives a tutorial on how...
Curated OER
Ornithology and Real World Science
Double click that mouse because you just found an amazing lesson plan! This cross-curricular Ornithology lesson plan incorporates literature, writing, reading informational text, data collection, scientific inquiry, Internet research,...
North Carolina State University
Exploring Genetics Across the Middle School Science and Math Curricula
Where is a geneticist's favorite place to swim? A gene pool. Young geneticists complete hands-on activities, experiments, and real-world problem solving throughout the unit. With extra focus on dominant and recessive genes, Punnett...
Curated OER
Finding Equations
Learners make equations from everyday data. They create a graph from the equations. Students predict and analyze the results. Learners complete the second scenario on their own and turn in their handout.
Curated OER
Raisin the Statistical Roof
Use a box of raisins to help introduce the concept of data analysis. Learners collect, analyze and display their data using a variety of methods. The included worksheet takes them through a step-by-step analysis process and graphing.
Curated OER
How's The Weather?
Students make a box and whiskers plot using the TI-73 graphing calculator. Each student would have their own calculator but they would work in small groups of two or three to help each other enter the data and make the plots.
Curated OER
Off to College
High schoolers investigate linear, quadratic and exponential equations using the TI calculator. They identify relation and functions using ordered pairs, graph the data, analyze the data, and relate it to real-world situations.
Curated OER
Height and Weight
Third graders explore their height and weight. They measure the heights and weights of their peers. Students record their data using an Excel spreadsheet. They create a graph to compare the data and analyze it for a correlation between...
Curated OER
Exploring Transformations with Matrices
A page right out of the Holt Geometry book. Use a graphing calculator and graph paper to explore transformations with matrices.
Other popular searches
- Analyzing Graphs Worksheets
- Analyzing Graphs Science
- Analyzing Graphs Math
- Analyzing Graphs Charts
- Making and Analyzing Graphs


