Curated OER
Literary Response and Analysis
Examine a variety of literary responses to Abraham Lincoln's death and the impact of perception. Your class can work in writing groups to analyze either poetry, eulogy, or a newspaper article. They retell the events of Abraham Lincoln's...
CK-12 Foundation
Graphs for Discrete and for Continuous Data: Discrete vs. Continuous Data
Not all data is the same. Using the interactive, pupils compare data represented in two different ways. The learners develop an understanding of the difference between discrete and continuous data and the different ways to represent each...
Bonneville
Solar Panel Data Sharing
It's important to share—especially in science. Pupils share the data on voltage, current, and resistance they recorded when they built circuits with solar cells in a previous lesson. They discuss the results with the class and consider...
McGraw Hill
Study Guide for Tuck Everlasting
Tuck Everlasting by Natalie Babbitt is a classic novel that readers have enjoyed for years. Resources within the study guide such as discussion and guided reading questions, extension activities, and graphic organizers aid comprehension...
Great Books Foundation
Discussion Guide for Jane Eyre
The ambiguity in Charlotte Bronte's Jane Eyre makes the novel a perfect choice for a shared inquiry discussion. Readers respond to open-ended questions with evidence drawn directly from the text.
National Wildlife Federation
The Tide is High, but I’m Holding On… Using ICESat Data to Investigate Sea Level Rise
Based on the rate of melting observed from 2003-2007 in Greenland, it would take less than 10 minutes to fill the Dallas Cowboys' Stadium. The 17th lesson in a series of 21 has scholars use the ICESat data to understand the ice mass...
C-SPAN
Historical Presidential Campaign Announcement Analysis
Using the announcements of presidential candidacies, pupils consider how contenders make their initial arguments to the public. A worksheet helps structure collaborative work to analyze 10 video clips. Writing prompts allow for extension...
Anti-Defamation League
The Revealers: Discussion Guide for Grades 6-8
Suspense! Rebellion! Cyberbullying! No wonder Doug Wilhelm's novel The Revealers appeals to middle schoolers. Instructors new to using the novel and experienced veterans will find this discussion guide invaluable. Discussion questions,...
Curated OER
Comparison of Univariate and Bivariate Data
Learners explore the concept of univariate and bivariate data. In this univaritate and bivariate data lesson, pupils discuss the differences between univariate and bivariate data. They work sample problems where they must construct box...
College Board
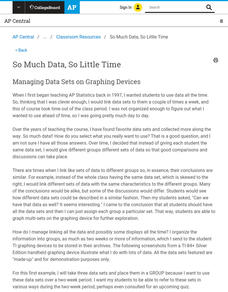
So Much Data, So Little Time
Organizing data in a statistics class is often a challenge. A veteran statistics teacher shares data organization tips in a lesson resource. The instructor shows how to group data to link to individual calculators in a more efficient...
Curated OER
Writing a Character Sketch
Combining descriptive and expository writing skills, middle schoolers create a character sketch about someone they know well. They use a graphic organizer to help them discuss a model character sketch and organize/write one of their own....
Curated OER
Show Me The Data!
Pupils create a bar graph. They will collect and organize data to turn into bar graphs. They create graphs for the favorite sports of the class, color of M&M's, and types of cars passing by.
Curated OER
Semantic Feature Analysis Chart: The Outsiders
Cool! Do you ned a way to increase vocabulary development and study a story's characters? What a great idea. Use this semantic analysis chart to study new vocabulary and the characters that appear in The Outsiders. You could also use...
Curated OER
Reading Primary Source Documents: Historical Content
Why do we read primary source documents? What can they give us that other writings cannot? Provide your learners with any of the primary sources attached here (there are seven), and have them complete the graphic organizer (which opens...
Curated OER
Many Ways to Represent Our Data
Demonstrate several ways to represent data with your class. They will use surveys to gather data and display the data using tally charts and graphs. Then answer questions according to the data.
Howard Hughes Medical Institute
Gorongosa: Scientific Inquiry and Data Analysis
How does the scientific process begin? Introduce ecology scholars to scientific inquiry through an insightful, data-driven lesson. Partners examine data from an ongoing research study to determine the questions it answers. The resource...
Curated OER
Discussion Questions for Shakespeare's Julius Caeser
Do not let Julius Caesar be Greek to your pupils. Rather, make the play a dish fit for hungry minds. Encourage your class members to lend their ears to a series of rich discussion questions so that they can become masters of the play, as...
Earth Watch Institute
Entering Local Groundhog Data in an Excel Spreadsheet
Here is a cross-curricular ecology and technology lesson; your learners create spreadsheets depicting the location and number of groundhog dens in a local park. They research groundhogs and analyze data about where the groundhog...
Curated OER
Data Analysis
Young statisticians use and interpret measures of center and spread such as mean, median, and mode as well as range. They use box plots to represent their data and answer questions regarding the correspondence between data sets and the...
Corbett Maths
Discrete and Continuous Data
Let's be discrete about the types of data. A short video provides the definitions of discrete and continuous data. After providing the definitions, the resource takes different types of data and sorts them based on type and provides an...
Curated OER
Cutting Expenses
Students explore budgeting. In this finance and math lesson, students brainstorm ways in which households could save money. Students view websites that give cost reducing ideas. Students complete an expense comparison chart and use the...
Curated OER
Differing Federal Responses to the Great Depression: Letter Analysis
Young analysts examine two letters, one written by President Hoover and one written by FDR. Each letter contains that president's response to the role of the Federal Government during times of crisis (The Great Depression). They analyze...
Curated OER
Character Analysis Chart
This versatile graphic organizer could be used alongside any novel, poem, play, or story through which your class in studying character. Class members can get characters straight or describe particular characters in more detail with this...
PBS
Student Helioviewer Data Tool
Scholars use current satellite data to view solar events, solar features, and so much more. It allows them to make videos over time to observe patterns and visually understand the sun at a much higher level using the interactive that is...
Other popular searches
- Organizing Data
- Collect and Organize Data
- Collecting and Organizing Data
- Word Analysis Skills
- Organizing Data in Tables
- Organize Data
- Literacy Analysis
- Case Study Analysis
- Ways to Organize Data
- Organizing Data Using Tables
- Math Lessons Organizing Data
- 5th Grade Organizing Data


