Curated OER
How Much Will I Spend On Gas?
Students construct a linear graph. In this graphing lesson plan, students determine a monthly budget for gasoline. Students construct a t-chart and coordinate graph to display data. Resources are provided.
Curated OER
Repeating Patterns
Students explore growth patterns by using manipulatives such as pattern blocks, investigate growth pattern of pattern, record growth in T-chart, describe how pattern is growing, and predict number of blocks needed to extend pattern.
Curated OER
The History of Mathematics
Research the interrelationship between math and science. Search the Internet to discover the history of several branches of mathematics and make text-to-world connections between the concepts covered in each branch with related...
Curated OER
Modeling in Algebra
In this modeling in algebra activity, 8th graders solve ten different types of algebra problems, including 5 word problems. They first complete each table, describe the pattern used, and determine the 20th and nth term for each. Students...
BW Walch
Creating Linear Inequalities in One Variable
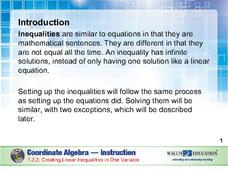
Just when a young mathematician starts to feel comfortable turning word problems into linear equations, shake things up and throw inequalities in the mix. This excellent, instructive presentation takes the steps for solving an equality...
Curated OER
Woody Sine
Students explore the concept of sine. For this sine lesson, students create a sine graph from tooth picks. Students create a unit circle with tooth pick length radius. Students then take the tooth picks from the unit circle and put them...
Curated OER
Which Car Should I Buy?
Students use gas mileage of different cars to create T charts, algebraic equations, and graphs to show which gets better mileage. For this gas mileage lesson plan, students use the graph to see which car they should buy.
Curated OER
Mathematics Within: Algebraic Processes and Its Connections to Geometry
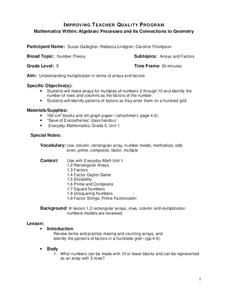
Fifth graders discover the connections between algebra and geometry. With a focus on arrays and factors, they are introduced to multiplication. They develop an array for multiples of 2 through 10 and identify the factors of each row....
Curated OER
Function Machines
In this math worksheet, students use function machines to complete an x/y T chart. Students convert between Celsius and Fahrenheit temperatures using a function machine.
Curated OER
Graphing Linear Equations
In this graphing worksheet, students graph ten linear equations on each of the graphs provided. They first plug in some values to the given equation using a T-chart. This will give them their coordinates to use on the graph and form...
Curated OER
Weaving a Story
It's time to investigate patterns! First and second graders construct a paper weaving using a hundreds chart, then use the Ti-10 calculator to make patterns such as adding 3 each time. Learners remove multiples of three from the hundreds...
Curated OER
Basic Algebra and Computers: Spreadsheets, Charts, and Simple Line Graphs
Young scholars, while in the computer lab, assess how to use Microsoft Excel as a "graphing calculator." They view visual representations of line graphs in a Cartesian plane while incorporating basic skills for using Excel productively.
Curated OER
Chart Your Course
Students explore change represented in graphs comparing distance and time. They exchange and share their graphs. Students interpret and create distance versus time line-graphs, and write stories based on these graphs. They interpret a...
Curated OER
Concepts, Patterns, Formulas, Substitution
In this algebra lesson, students define algebraic terms and rewrite them using math symbols. There are 10 problems drawing correlations to geometry as well as algebra.
West Contra Costa Unified School District
Square and Square Roots
Root for your pupils to learn about roots. Young mathematicians first review the meaning of squares and square roots. They then use this knowledge to simplify square roots of monomials with variables.
Curated OER
Extreme Elevations
Seventh graders use highest and lowest points of land elevation around the world to find the differences. Sea level is zero, so students be operating with positive and negative numbers. After students find the information on the...
Curated OER
Cannot Buy Me Love
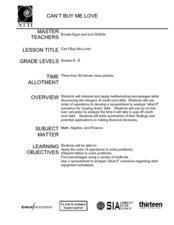
Pupils investigate the concepts that are related to finance and how it is used in the world. They take part in activities that are focused around the use of a spreadsheet while using a T-chart to simulate a ledger of credits and debits.
Curated OER
Each Orange Has 8 Slices
Students use pattern blocks to develop an understanding of algebraic generalization(pattern) in order to write a mathematical equation using algebraic symbols.
Curated OER
Can you Find the Expression
Young scholars collect data from measurements and weights for this experiment. For this algebra lesson, students analyze graphs they create form their data to find the expression representing the data. They label which graph provided the...
Curated OER
Linear Equations
Students solve linear equations by modeling. In this algebra instructional activity, students solve one and two step inequalities and equations. They use manipulative to create a visual of the steps.
Curated OER
Don't Lose Your Load!
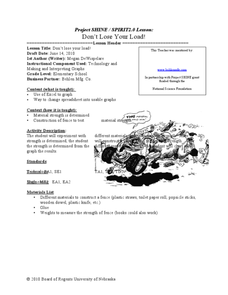
Pupils create graphs using collected data. In this algebra lesson, students use spreadsheet in Excel to create graphs to interpret their data and make predictions. They rewrite word problems using algebraic expressions.
Curated OER
In Round Numbers
Students explore the concept of rounding. In this rounding lesson, students use their calculator to round three digit numbers to the nearest 10 or nearest 100. Students round fractional numbers to the nearest tenth, hundreth, and...
Curated OER
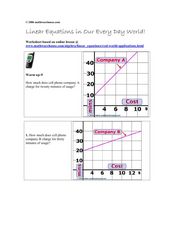
Linear Equations in Our Every Day World!
In this linear equations worksheet, high schoolers read and interpret graphed linear equations. They read a story problem, write a linear equation, and plot the points on a coordinate plane. This five-page worksheet cotnains 12 problems.
Inside Mathematics
Graphs (2004)
Show your pupils that perimeter is linear and area is quadratic in nature with a short assessment task that requests learners to connect the graph and equation to a description about perimeter or area. Scholars then provide a...


