Curated OER
Graphing Parabolas and Circles
Students graph parabolas and circles. In this algebra lesson plan, students create a table of values and graph the coordinate pairs to create a graph. They graph a circle using the radius and center.
Curated OER
Graphing Linear Equations Using the Table Method
Students graph linear equations using a table. In this algebra lesson, students create a table of values using the linear equation to find the y-values. They plot their point on a coordinate plane and graph the line.
Curated OER
Solving Inequalities and Graphing
Students solve and graph inequalities on a number line. In this algebra lesson, students solve using addition, subtraction, multiplication and division and graph their solutions using open or closed circles. They graph with 80%-90%...
Curated OER
Graphing With RXTE
Learners use data from the Rossi X-ray Tiiming Explorer (RXTE) satellite to analyze and graph.
Curated OER
Dog Days or Dog Years?
In need of some algebraic fun with real world implications?Learners use ordered pairs, a table of values and a scatter plot to evaluate the validity of several real world data sets. The class focuses on dog ages in human...
Curated OER
Exponential vs. Power
Pupils differentiate between exponential and power functions. They identify the base, exponent and properties of exponential functions. They also graph the functions using the TI calculator.
Curated OER
Sequences
Students solve problems using the TI. In this calculus lesson, students evaluate functions using sequences. They graph the functions on the TI and make observations.
Curated OER
TI Math, Games
Students solve problems using technology. In this algebra lesson, students apply flow diagrams and computer codes to solve problems. They use the TI to view the graphs.
Curated OER
Rational Function Graphs
Pupils use algebraic methods to represent and solve problems. Using a graphing calculator, students solve rational and inequality problems. They visually demonstrate solutions of functions through graphing. Pupils answer questions...
Curated OER
Between The Extremes
Students analyze graphs for specific properties. In this algebra lesson, students solve equations and graph using the TI calculator. They find the different changes that occur in each graph,including maximum and minimum.
Curated OER
Tune...Um!
Students collect real data on sound. In this algebra lesson plan, students use a CBL and graphing calculator to observe the graph created by sound waves. They draw conclusion about the frequency of sound from the graph.
Curated OER
Lines of Best Fit
High schoolers determine if there is an associationm in a scatter plot of data. They analyze data through predictios, comparisons, and applications. Students calculate the line of best fit using a graphing calculator. They display data...
Kenan Fellows
Density
Most scholars associate density with floating, but how do scientists determine the exact density of an unknown liquid? The third lesson in a seven-part series challenges scholars to find the mass and volume of two unknown liquids. Each...
Curated OER
Bouncing Ball
Students collect height versus time data of a bouncing ball using the CBR 2™ data collection device. Using a quadratic equation they graph scatter plots, graph and interpret a quadratic function, apply the vertex form of a quadratic...
Noyce Foundation
Pizza Crusts
Enough stuffed crust to go around. Pupils calculate the area and perimeter of a variety of pizza shapes, including rectangular and circular. Individuals design rectangular pizzas with a given area to maximize the amount of crust and do...
Inside Mathematics
Population
Population density, it is not all that it is plotted to be. Pupils analyze a scatter plot of population versus area for some of the states in the US. The class members respond to eight questions about the graph, specific points and...
5280 Math
More or Less the Same
Tell the story of the math. Given a graph of a linear system, learners write a story that models the graph before crafting the corresponding functions. Graphs intersect at an estimated point, allowing for different variations in the...
Natinal Math + Science Initative
Slope Investigation
Context is the key to understanding slope. A real-world application of slope uses a weight loss scenario with a constant rate of change to introduce the concept of slope of a line, before it makes a connection to the ordered pairs...
Charleston School District
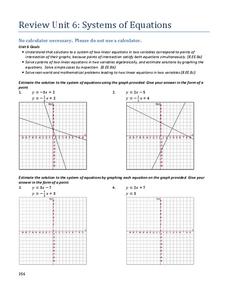
Review Unit 6: Systems of Equations
It's time to show off what they learned! The final lesson in the series is a review worksheet on the topics learned throughout the unit. Scholars solve systems of equations using graphic and algebraic methods, solve system-based word...
Inside Mathematics
Coffee
There are many ways to correlate coffee to life, but in this case a worksheet looks at the price of two different sizes of coffee. It requires interpreting a graph with two unknown variables, in this case the price, and solving for...
Noyce Foundation
Ducklings
The class gets their mean and median all in a row with an assessment task that uses a population of ducklings to work with data displays and measures of central tendency. Pupils create a frequency chart and calculate the mean and median....
Charleston School District
Pre-Test Unit 6: Systems
As if solving equations with an x isn't tricky enough, now they add a y, too? A pre-assessment gauges the knowledge of your classes related to systems. They are asked to solve graphically and algebraically and to solve word...
California Education Partners
Miguel's Milkshakes
Moooove over, there's a better deal over there! The fourth segment in a series of eight requires individuals to determine the best unit cost for milk. Scholars calculate the least amount they can spend on a particular quantity of...
Curated OER
Mathematical Modeling
Study various types of mathematical models in this math lesson. Learners calculate the slope to determine the risk in a situation described. They respond to a number of questions and analyze their statistical data. Then, they determine...
