Curated OER
The X Factor - Trinomials and Algebra Tiles
Learners use algebra tiles to identify the binomial factors and the graphing calculator to verify the result. In addition, they will identify the x-intercepts and y-intercepts of each trinomial function and explore relationships between...
Curated OER
Investigating Parabolas
For this investigating parabolas worksheet, 9th graders solve and graph 7 different problems that include graphing various equations that represent parabolas. First, they sketch their graphs to each problem. Then, students determine what...
Curated OER
Graphing Inequalities in Equations
Can a person solve and graph inequalities in one variable? Sounds impossible but it's not! Young mathematicians solve and graph inequalities in algebraic equations. They find a range of possible values for a variable as they solve...
Curated OER
Graphical Analysis
Get out your TI-nspire graphing calculator and explore polynomials. Learners determine where a given polynomial are increasing or decreasing, find maximums, minimums, and zeros of polynomials, and discuss end behavior of polynomials....
Curated OER
Systems of Equations and Real Life
What a great classroom resource! The intention of this instructional activity is to show that real-world math can and should be applied to the community in which your students reside. The class relates properties of equations to solving...
EngageNY
Changing the Base
I can't calculate a base-2 logarithm since my calculator doesn't have a base-2 log key. Young mathematicians use the change of base formula to extend the properties of logarithms to all bases. Among these bases is the natural log base,...
EngageNY
Comparing Rational Expressions
Introduce a new type of function through discovery. Math learners build an understanding of rational expressions by creating tables and graphing the result.
EngageNY
Interpreting Correlation
Is 0.56 stronger than -0.78? Interpret the correlation coefficient as the strength and direction of a linear relationship between two variables. An algebra lesson introduces the correlation coefficient by estimating and then...
EngageNY
Modeling a Context from a Verbal Description (part 1)
When complicated algebraic expressions are involved, it is sometimes easier to use a table or graph to model a context. The exercises in this lesson are designed for business applications and require complex algebraic...
Curated OER
Bouncing Ball : Function Families
A bouncing ball serves as more than entertainment when learning to apply quadratic functions to real-world events. This is the second of a two-part lesson, which can also be accessed from the website. The instructions say to measure the...
Curated OER
Watch Your P's and Q's
Using your graphing calculator, find all the rational zeroes of a polynomials by using the Rational Zero Theorem. Divide polynomials using the Remainder Theorem and the Factor Theorem and then graph it to find the number of real roots.
Curated OER
Polynomials and Linear Factors
This algebra worksheet reviews writing polynomials in standard form from factored form, looks at the graphs of polynomials of degree higher than two, and identifies the zeros of polynomials using the Factor Theorem and Fundamental...
Curated OER
Complex Numbers
The class practices, on paper and/or on a TI graphing calculator the concepts of how to add, multiply, divide and subtract complex numbers using the correct property.
Curated OER
Middle Grades Math: Balancing Equations
Learners solve linear equations. By observing the graph of each side of an equation using the TI-nspire graphing calculator, your class gains insight into solutions, as well as balancing equations and transforming linear equations....
Texas Instruments
Let's Play Ball with Families of Graphs
Learners explore quadratic equations in this Algebra II lesson. They investigate families of quadratic functions by graphing the parent function and family members on the same graph. Additionally, they write the equation of the parabola...
Curated OER
Baseball Relationships - Using Scatter Plots
Students use graphing calculators to create scatter plots of given baseball data. They also determine percentages and ratios, slope, y-intercepts, etc. all using baseball data and statistics.
Curated OER
Stretching the Quads
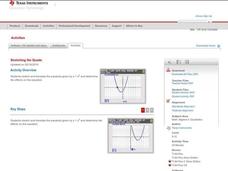
Explore parabolas in this algebra lesson with the graphing calculator. The class investigates what effects the changing of the parameters of the vertex form of a quadrati have to its graph. They find the zeros of a quadratic graphically...
Curated OER
Newton's Law of Cooling
Your Algebra learners analyze and solve an exponential equation in this popular, real-life model of the cooling of a liquid.
Concord Consortium
Swimming Pool II
Combine geometry and algebra concepts to solve a modeling problem. Young scholars consider the effect surface area has on volume. They write a cubic function to model the possible volume given a specific surface area and then...
Curated OER
Calculating Slope
Students find the slope using a slope formula. In this algebra worksheet, students use a pair of coordinate to identify the slope and y intercept. There are 7 questions.
Texas Instruments
2B or not 2B a Functions
Learners use their graphing calculators to view graphs of equations. They tell if each equations is or is not a function and are shown pre-set graphs on their graphing calculators. They use the Quick Poll feature to indicate if the graph...
Curated OER
Graphing Calculator Investigation - Second Degree Polynomial Functions
Young scholars solve quadratic functions. In this solving quadratic functions lesson plan, students determine the height of an object at a given time. Young scholars determine the time at which an object hits the ground. Students answer...
Curated OER
Stretching the Quads
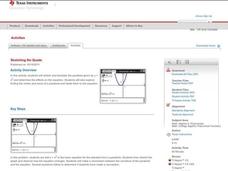
Scholars investigate transforming parabolas. In this transforming parabolas lesson, they take the parent graph y=x^2 and transform it by shifting left, right, up, and down and shrinking and stretching. The class finds maximums,...
Curated OER
Murder in the First Degree - The Death of Mr. Spud
Secondary learners investigate exponential functions in a real-world scenario. They collect data on the temperature of a cooling baked potato, enter the data into lists, and graph the data using a scatter plot before finding an...


