Curated OER
Let's Party like its 1849
Students explore prairie life. In this Oregon Trail lesson, students read literature regarding the move west and participate in cross-curricular activities. Students should take digital photographs of the participation in activities and...
Curated OER
Daily Job Chart
In this cooperative learning accountability learning exercise, learners determine the roles for each group member and how they will rotate throughout a week.
Curated OER
The Geometry of Real Images
For this math worksheet, students read the examples for using the techniques of mathematical modeling. They draw the angles in order to simulate the reflection of light while using a concave mirror.
Curated OER
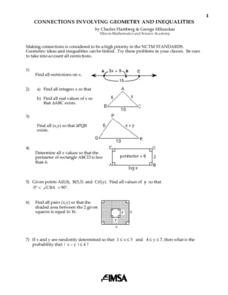
Connections Involving Geometry And Inequalities
In this math worksheet, students investigate inequalities using problems like: If x and y are randomly determined so that 1 < x < 3 and 4 < y < 7, then what is the probability that | x – y |< 4?
National Research Center for Career and Technical Education
Finance: Depreciation (Double Declining)
Of particular interest to a group of business and finance pupils, this lesson explores depreciation of automobile values by comparing the double declining balance to the straight line method. Mostly this is done through a slide...
National Research Center for Career and Technical Education
Information Technology: Photoshop Scale
Scaling is a practical skill as well as a topic to be addressed throughout the Common Core math standards. You are given three different presentations and a detailed teacher's guide to use while teaching proportion, as well as practice...
National Research Center for Career and Technical Education
STEM: Lou-Vee Air Car
A comprehensive lesson on acceleration awaits your physicists and engineers! Two YouTube videos pique their interest, then sample F=ma problems are worked and graphed. The highlight of the lesson is the building of a Lou-Vee air car!...
Statistics Education Web
Which Hand Rules?
Reaction rates vary between your dominant and nondominant hand ... or do they? Young scholars conduct an experiment collecting data to answer just that. After collecting data, they calculate the p-value to determine if the difference is...
American Statistical Association
An A-MAZE-ING Comparison
Teach your class how to use descriptive statistics through a hands-on data collection activity. Pupils collect their own data, calculate test statistics, and interpret the results in context. They compare male and female results, looking...
American Statistical Association
Armspans
Young mathematicians collect data on the arm spans of classmates. Then they sort the data by measures of center, spread, and standard deviation. Finally, they compare groups, such as boys and girls, to interpret any differences.
Statistics Education Web
Sampling in Archaeology
Compare different random sampling types using an archaeological setting. Scholars collect data from an archaeological plot using simple random samples, stratified random samples, systematic random samples, and cluster random samples....
Statistics Education Web
How High Can You Jump?
How high can your pupils jump? Learners design an experiment to answer this question. After collecting the data, they create box plots and scatter plots to analyze the data. To finish the activity, they use the data to draw conclusions.
Statistics Education Web
Using Dice to Introduce Sampling Distributions
Investigate the meaning of a sample proportion using this hands-on activity. Scholars collect data and realize that the larger the sample size the more closely the data resembles a normal distribution. They compare the sample proportion...
National Research Center for Career and Technical Education
Hospitality and Tourism 1: Safety and Sanitation
Math and science come alive in this career-related lesson on sanitation. Along the way, learners explore bacterial growth rates using exponential notation and graphs. A link to a very brief, but vivid video shows just how quickly these...
National Research Center for Career and Technical Education
Hospitality and Tourism 2: Costing
The lesson plan provides a richly detailed narrative and sample problems for teaching or reinforcing how to work with percentages. In particular, your audience will compute the costs per serving of food and simulate setting menu prices...
National Research Center for Career and Technical Education
Transportation, Distribution, and Logistics: Tire and Wheel Assemblies
Is bigger really better? By the end of this lesson, learners will be able to apply formulas for computing the diameter of tires and wheel assemblies. Begin by showing a slide presentation that will review definitions for radius and...
National Research Center for Career and Technical Education
Manufacturing: Gas Metal Arc Welding (GMAW) Shielding Gas Mix
Middle schoolers apply math to the real-world skill of choosing the correct shielding gas mixture for welding. Even if you do not have shielding gas cylinders on hand for demonstrating, the concepts of converting percentages into...
Statistics Education Web
Saga of Survival (Using Data about Donner Party to Illustrate Descriptive Statistics)
What did gender have to do with the survival rates of the Donner Party? Using comparative box plots, classes compare the ages of the survivors and nonsurvivors. Using the same method, individuals make conclusions about the gender and...
Curated OER
Create a Math Road Trip
Students create a Road Trip. They work in small groups. Students are given a road map for each group. They plan a road trip between two cities on opposite edges of the map, estimating a reasonable distance to travel each day. Students...
Curated OER
Weather Watchers
Students are introduced to an Underground Weather Stations. In groups, they use the internet to research the weather in different parts of the United States locating each city. To end the lesson, they summarize the information they...
National Research Center for Career and Technical Education
Health Science: Back to Basics
This instructional activity focuses on unit conversion, proportions, ratios, exponents, and the metric system. Discuss measurement with your math class and demonstrate how to solve several health-science word problems. Give learners a...
Curated OER
Graphing
Students collect data and graph their results, then analyze the graphs. In this geometry lesson, students examine slopes and their graphs and discuss the relationship between the lines and the slopes.
Curated OER
Time Changes Everything
Students analyze census data from 1915, 1967 and 2006. They read an article about how the world's population is growing at an alarming rate. They use primary source documents to create a timeline on the information they gathered. They...
Curated OER
Harvesting the Produce
Students investigate vegetables. In this multi-subject lesson, students learn about vegetables and participate in several activities using vegetables. A list of 7 materials is included.
Other popular searches
- Accounting Journal Entries
- Journalizing Accounting
- Accounting Journal Entries
- Accounting Journal 5 Column
- Accounting Journal Entrys


