Southwestern Medical Center
Field Epidemiology: Investigation of an Unknown Disease
More than 90 percent of the people in a building have come down with an illness, and it is your job to investigate. Teachers give scientists the data needed to decide what is important and how they can solve the mystery. The exercise is...
Los Angeles County Office of Education
Assessment for the California Mathematics Standards Grade 3
Assess scholars' knowledge with a 22-page assessment that covers place value, patterns, probability, estimation, measurement, geometric figures; and their ability to add, subtract, multiply and divide proficiently.
EngageNY
Margin of Error When Estimating a Population Proportion (part 2)
Error does not mean something went wrong! Learners complete a problem from beginning to end using concepts developed throughout the last five lessons. They begin with a set of data, determine a population proportion, analyze their result...
EngageNY
Sampling Variability in the Sample Mean (part 1)
How accurate is data collected from a sample? Learners answer this question using a simulation to model data collected from a sample population. They analyze the data to understand the variability in the results.
Balanced Assessment
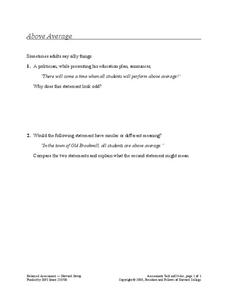
Above Average
Raise the bar and strive to be above average. The assessment task requires budding mathematicians to think critically and evaluate given statements. What does it truly mean to be above average?
Bowland
Crash Test
Use mathematics and simulations to investigate car crashes. IScholars test hypotheses involving car crashes. They collect, analyze, and display data from computer simulations to support or refute their hypotheses.
Bowland
Mystery Tours – Plan Your Tour
Everyone loves a vacation and a set of three activities has groups planning a tour of the U.K. using given distance, time, and price data. They solve a variety of problems related to the trip and produce a report on the success of the trip.
Bowland
Olympic Cycling
Teach teenagers to think critically about data. Young data analysts must create two questions that can be answered using a provided data set on Olympic cycling times. Of course, they then have to answer their questions using mathematics.
Balanced Assessment
Movie Survey
Movie preferences will get your classes talking! Individuals read a pie graph and construct a bar graph using the same information. They then answer questions specific to the data and sample size.
Rochester Institue of Technology
Ergonomic Design
To an engineer, the glass is never half full; it's just double the necessary size. The fifth installment of a nine-part technology and engineering series teaches pupils about the idea of ergonomic design. Measurements of popliteal height...
Curriculum Corner
Measures of Central Tendency
Reinforce the concept of central tendency—mean, median, mode, and range—with a practice packet that comprises of eight problems and a structured answer sheet with plenty of room to show work.
Balanced Assessment
The Triskaidecaphobia Conference
Triskaidecaphobia is an extreme superstition to the number 13—and ironically the answer to the word problem is 13! Presented with a series of descriptive data, individuals analyze the data to determine the population size. They must...
Intel
Energy Innovations
Collaborative groups examine the importance of energy resources on quality of life by researching different energy sources and alternative energy sources through data analysis. They make a comparison of different countries and cultures,...
EngageNY
The Mean as a Balance Point
It's a balancing act! Pupils balance pennies on a ruler to create a physical representation of a dot plot. The scholars then find the distances of the data points from the balance point, the mean.
EngageNY
Variability in a Data Distribution
Scholars investigate the spread of associated data sets by comparing the data sets to determine which has a greater variability. Individuals then interpret the mean as the typical value based upon the variability.
EngageNY
Creating a Histogram
Display data over a larger interval. The fourth segment in a 22-part unit introduces histograms and plotting data within intervals to the class. Pupils create frequency tables with predefined intervals to build histograms. They describe...
EngageNY
The Mean Absolute Deviation (MAD)
Is there a way to measure variability? The ninth resource in a series of 22 introduces mean absolute deviation, a measure of variability. Pupils learn how to determine the measure based upon its name, then they use the mean absolute...
EngageNY
Comparing Data Distributions
Box in the similarities and differences. The 19th lesson in a unit of 22 presents class members with multiple box plots to compare. Learners use their understanding of five-number summaries and box plots to find similarities and...
101 Questions
Class Height Distribution
A picture is worth a thousand words, and this is no exception! The introductory photo shows a group of classmates lined up in height categories; females and males are in different colors, and the shape of the curve they create is...
101 Questions
Representative Sample
At what point does data switch from being an outlier to part of the average? Scholars view conflicting news articles about protesters. They must decide which, if any, side is using the correct sample to draw their conclusions. It's a...
PBS
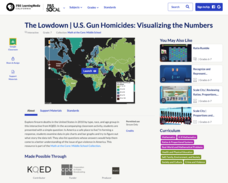
The Lowdown — U.S. Gun Homicides: Visualizing the Numbers
Is gun violence a big issue in America? Pupils explore gun deaths by type, race, and age group in a Math at the Core: Ratios interactive. The class tries to determine whether America is a safe place to live and use bar graphs and pie...
Mathed Up!
Questionnaires
Check the appropriate box. Class members determine whether a questionnaire is an appropriate one. The portion of the General Certificate of Secondary Education math assessment review requires pupils to create a valid questionnaire to...
CCSS Math Activities
Smarter Balanced Sample Items: 7th Grade Math – Target H
Not one but two box plots. How will your pupils fare? Assess their understanding of box plots by having them compare two populations. The eighth of nine installments in the Gr. 7 Claim 1 Item Slide Shows series, the resource has them...
CCSS Math Activities
Smarter Balanced Sample Items: 7th Grade Math – Target G
Don't leave learning to chance! Assess your class's understanding of random sampling and making inferences using questions from the experts at Smarter Balanced. As the seventh of nine parts in the Gr. 7 Claim 1 Item Slide Shows series,...
Other popular searches
- Data, Census, & Statistics
- Probability and Statistics
- Educational Statistics
- Baseball Statistics
- Math Statistics
- Climate Statistics
- Math Lessons Statistics
- Median and Mean Statistics
- Statistics Lesson Plans
- Sports and Statistics
- Probability Statistics
- Black Plague Statistics


