Corbett Maths
Area under a Graph
What? The calculation of area is a linear distance? A short video shows how to use the areas of simple polygons to estimate the area under a graph. Pupils divide the area under a curve into figures to easier calculate the area. Given...
Curated OER
Standard Units of Measure
Learners explore linear measurement. They choose appropriate measuring tools, measure three classroom items, and record their results. A class discussion ensues in which everyone decides the best way to present their data.
Teach Engineering
About Accuracy and Approximation
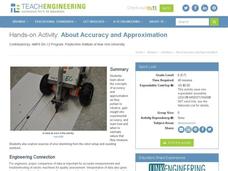
How accurate are robots? Groups draw lines by moving robots backwards and forwards by one rotation of the wheels. Using the appropriate formula, they determine the percent error in the length of the lines in relation to the calculated...
PBS
Scale City — Scaling up Recipes and Circles in the Real World
What a great big skillet you have. The resource introduces the class to the world's largest stainless steel skillet. The class creates a model of the skillet and a typical 12-inch skillet and compares the relative sizes of their areas....
Charleston School District
Solving Systems Graphically
When guess and check gets old, it's time to start graphing! An instructive lesson explains how to solve a system of linear equations using graphing. Equations are in both slope-intercepts and standard form.
Curated OER
Taylor's Theorem
In this Taylor's Theorem worksheet, students use the microscope approximation to determine the approximate value of a function. They rewrite expressions for the relative error, and observe changes in the relative error. They use...
Curated OER
Analyzing Solutions Computed Using Euler's Method
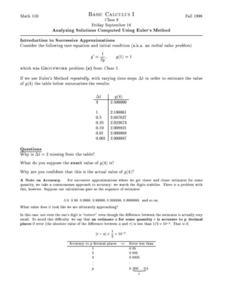
In this analyzing solutions learning exercise, students use Euler's Method to estimate the value of given functions. They estimate solutions using the piecewise-linear function model and sketch the information onto a graph. This...
Curated OER
Using Inequalities to Problem Solve
Learners explore inequalities. In this Algebra I lesson, students solve and graph linear inequalities involving addition, subtraction, multiplication, or division. Learners use inequalities to solve and graph real-world problems.
Curated OER
French Fry Run
Student explore estimation and measurement. In this measurement instructional activity, 2nd graders measure french fries, graph their data, and determine the size of french fries that is the best value. Students practice how to add...
Curated OER
Linear Systems: Least Squares Approximations
In this least squares approximation worksheet, students determine the number of solutions a given linear system has. They find the least square error and the equation of a line of best fit for a set of three points. Students find the...
Curated OER
Math 155 - Fall 2005 Differentiation
For this differentiation worksheet, students find an equation of a line tangent to a curve. They use linear approximation to estimate answers. This two-page worksheet contains approximately 12 multi-step problems.
Shodor Education Foundation
InteGreat
Hands-on investigation of Riemann sums becomes possible without intensive arithmetic gymnastics with this interactive lesson plan. Learners manipulate online graphing tools to develop and test theories about right, left, and midpoint...
101 Questions
Blocks
Block play can teach children about gravity, physics, and spatial relationships. A hands-on lesson incorporates these concepts with an activity in which learners examine the relationship between levels in a pile. Scholars begin to...
Curated OER
It Takes Ten
Review and use standard units of measure with your math class. They move from station to station estimating and measuring length, volume, weight, and area. At each station they estimate and measure, and then compute the difference...
Curated OER
ExplorA-Pond:4th Grade Perimeter Estimation
Fourth graders visit a real pond. They mark the pond's curvilinear perimeter using string. They measure the string to find the actual perimeter of the pond.
Centre for Innovation in Mathematics Teaching
Ten Data Analysis Activities
This thirteen page data analysis worksheet contains a number of interesting problems regarding statistics. The activities cover the concepts of average measurements, standard deviation, box and whisker plots, quartiles, frequency...
Curated OER
Statistics with M&Ms
Seventh graders explore estimation, measurement, and probability. Students conduct surveys and create charts & graphs. They study the history of chocolate. Students design their own magazine advertisement or create a script for a...
Curated OER
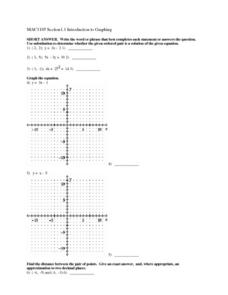
Introduction to Graphing
In this graphing worksheet, learners graph linear equations on a coordinate plane. Students identify the slope and y-intercept of each problem, find the midpoint of a line, and the distance between given points. Given an equation,...
Inside Mathematics
Graphs (2006)
When told to describe a line, do your pupils list its color, length, and which side is high or low? Use a instructional activity that engages scholars to properly label line graphs. It then requests two applied reasoning answers.
Alberta Learning
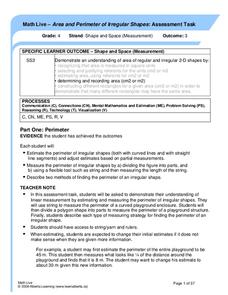
Area and Perimeter of Irregular Shapes
Evaluate young mathematicians' understanding of area and perimeter with this series of three assessment tasks. Challenging students to not only calculate the area and perimeter of irregular shapes, but to explain in writing their...
Willow Tree
Approximating a Line of Best Fit
You may be able to see patterns visually, but mathematics quantifies them. Here learners find correlation in scatterplots and write equations to represent that relationship. They fit a line to the data, find two points on the line, and...
California Education Partners
T Shirts
Which deal is best? Learners determine which of two companies has the best deal for a particular number of shirts. They begin by creating a table and equations containing each company's pricing structure. Individuals finish the seventh...
Curriculum Corner
8th Grade Math "I Can" Statement Posters
Clarify the Common Core standards for your eighth grade mathematicians with this series of classroom displays. By rewriting each standard as an achievable "I can" statement, these posters give students clear goals to work toward...
101 Questions
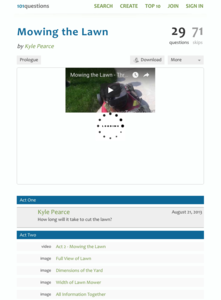
Mowing the Lawn
It'll take as long as it'll take. After watching a short video clip of someone moving a lawn as well as a running stopwatch, pupils estimate how long it would take to mow the entire lawn. Provided diagrams show the dimensions of the lawn...


