Academy of American Poets
Teach This Poem: "Wonder and Joy" by Robinson Jeffers
A study of Robinson Jeffers' poem "Wonder and Joy" reminds readers to notice and rekindle the appreciation of the many wondrous aspects of life. After a close reading of the poem, scholars use the provided questions to discuss the poem.
Polar Trec
Create a Topographic Profile of Beacon Valley
Landforms in Beacon Valley, Antarctica, where there is no snow, bear a striking resemblance to landforms found on Mars. Scholars identify landforms found in Beacon Valley through analysis of topographic maps in the activity. They then...
Curated OER
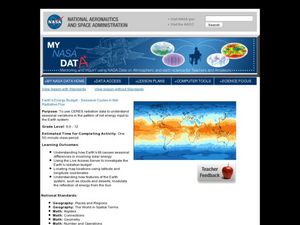
Earth's Energy Budget - Seasonal Cycles in Net Radiative Flux
Students attempt to understand seasonal variation by viewing images of the energy received by the earth. In this weather lesson, students view images from NASA of the influx of energy from the sun and make predictions about resulting...
Curated OER
Analyzing Tree Rings to Determine Climate Change
Students examine how to locate and access data sets. In this climate change instructional activity students import data into Excel and graph it.
Curated OER
Slope, Vectors, and Wind Pressure
A hands-on lesson using the TI-CBR Motion Detector to provide information to graph and analyze. The class uses this information to calculate the slope of motion graphs and differentiate scalar and vector quantities. There is a real-world...
Institute of Electrical and Electronics Engineers
Cast Your Vote
In a simple but unique instructional activity, youngsters learn about the history of voting systems. They then collaborate in groups to develop a new honest and consistent voting method. A class-wide poll is taken, evaluating the designs...
Curated OER
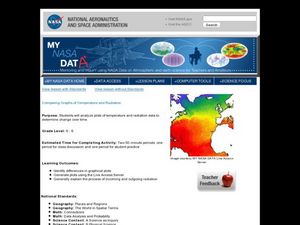
Comparing Graphs of Temperature and Radiation
Students study plots and use a Live Access Server to generate plots. In this temperature lesson students examine the process of incoming and outgoing radiation.
Curated OER
Differences Between Ground and Air Temperatures
Students examine the differences between air temperature and ground temperature. For this investigative lesson students find NASA data on the Internet and use it to create a graph.
Curated OER
Hurricanes As Heat Engines
Young scholars examine sea surface temperatures to see how hurricanes get heat from the oceans surface. In this hurricanes lesson students use the Internet to find data and make line plots.
Curated OER
Is Grandpa Right, Were Winters Colder When He Was a Boy?
Young scholars compare current weather data to historic data to see if there is a temperature change. In this weather instructional activity students complete a lab activity and determine average changes in temperature, precipitation...
Curated OER
Investigating Seasonal Variability in NO2 Concentrations
Young scholars study different formats of data and determine the nitrogen dioxide concentrations. In this seasons lesson students understand the different relationships that NO2 can have.
Curated OER
Solar Cell Energy Availability From Around the Country
Students determine areas that are the most likely to produce solar energy by using NASA data. In this solar energy lesson plan students analyze plots and determine solar panel use.
Institute of Electrical and Electronics Engineers
Trebuchet Toss
Young engineers work in teams to design and build their own trebuchets according to certain criteria; they must be able to launch a mini marshmallow accurately into a pie tin. Background reading material, a planning sheet for trebuchet...
Curated OER
Sustainable Forestry
High schoolers evaluate a forest for timber harvest and discuss potential impacts of logging. For this sustainable forestry lesson, they work in groups in a forested plot to choose trees to cut based on species and stem diameter and then...
Institute of Electrical and Electronics Engineers
Build a Big Wheel
What does it take to prepare for a construction project? In an engineering lesson plan, youngsters examine how a Ferris wheel can turn and carry a load without falling apart. After reading up on big wheel designs, they create a model...
Earth Watch Institute
Entering Local Groundhog Data in an Excel Spreadsheet
Here is a cross-curricular ecology and technology lesson; your learners create spreadsheets depicting the location and number of groundhog dens in a local park. They research groundhogs and analyze data about where the groundhog...
Curated OER
Poetry: Walking With My Iguana
Bring a little excitement to your next poetry analysis lesson. Using the highly energetic poem "Walking With My Iguana," learners consider poem structure and rhyme. They listen to the poem, discuss the rhythm and tone with their...
Curated OER
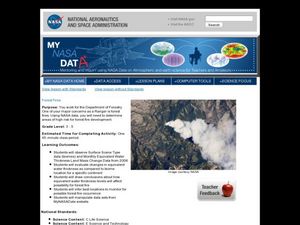
Forest Fires
Students play the role of a Ranger with the Department of Forestry. In this forest fires instructional activity, students examine data on biomes and images to determine high risk areas for forest fires to develop.
Curated OER
Cold, Clouds, and Snowflakes
Students explore satellite data and graphing. In this weather data analysis math and science lesson, students analyze NASA satellite data to draw conclusions about geographical areas where precipitation might have happened. Students...
Curated OER
Creating Climographs
Students use satellite data to compare precipitation and surface temperatures on different islands. In this satellite lesson students create graphs and explain the differences between weather and climate.
Curated OER
Dry Season and 'Green' Season in Costa Rica
Students explore the seasonal changes in Costa Rica. In this dry season lesson students use the Internet to locate science data then generate data for precipitation.
Curated OER
Is Portland, Oregon Experiencing Global Warming?
Young scholars use data to determine if the climate in Portland has changed over the years. In this weather lesson students complete line graphs and study long wave radiation.
Curated OER
Storm Clouds-- Fly over a Late Winter Storm onboard a NASA Earth Observing Satellite
Students study cloud data and weather maps to explore cloud activity. In this cloud data instructional activity students locate latitude and longitude coordinates and determine cloud cover percentages.
Curated OER
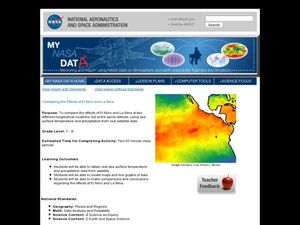
Comparing the Effects of El Nino and La Nina
Students examine the differences between an El Nino and La Nina year. In this investigative lesson students create maps and graphs of the data they obtained.
Other popular searches
- Social Skills Lesson Plans
- Map Skills Lesson Plans
- Spanish Lesson Plans
- Short Vowel Lesson Plans
- Common Nouns Lesson Plans
- Graphing Skills Lesson Plans
- Sports Lesson Plans
- Art Lesson Plans
- Fact Opinion Lesson Plans
- Esl Lesson Plans
- Social Studies Lesson Plans
- Coping Skills Lesson Plans


