Hi, what do you want to do?
Curated OER
Using a Table
Tables are no help if your scholars can't read them; provide some excellent beginner-practice using this table example and accompanying comprehension questions. Learners examine the data first, which charts the number of glasses of water...
Curated OER
Reading Tables
Who is two years younger than Meg? Who is older than Paul, but not Kinta? Scholars practice reading tables as they answer comprehension questions based on three sets of data. First, they examine a table depicting ages, then favorite...
Curated OER
Number Pairs
As you introduce graphs and coordinate pairs, use this guided activity to get scholars started. They reference an example before recording number pairs to identify the location of 12 letters on a grid. Next, learners examine shapes on a...
Curated OER
Bar Graphs
Introduce scholars to bar graphs and data analysis through analyzing these visual examples. First, they look at a pictograph of fruit types and answer five observation questions. There is one done for them as an example. Learners do the...
Curated OER
Line Graphs
Let's take a look at Luis' bike ride! Scholars examine a line graph charting a 20-kilometer bike ride over the course of six hours. They answer six questions about the data requiring the understand the concepts of each axis and the line...
Curated OER
Coordinates
For beginning point plotters, these graphs give a good introduction. They examine a graph with shapes drawn onto it and each vertex labeled. There are 20 total, and scholars write the coordinates of each labeled point. All of these are...
Curated OER
Coordinate Graphs
As you introduce coordinate graphs to scholars, be sure to use guided worksheets like this one. Using an example for guidance, they write the coordinates of five points on a graph, each distinguished as a shape symbol. Next, scholars do...
Curated OER
Graphs
For beginners to picture graphs this is the perfect resource. They analyze two bar graphs that break down data visually so scholars can actually count the number in each column. For the first, they fill in how many of each type of pet is...
Curated OER
Valentine Candy Count
Here is an imaginative take on a classic lesson! Young scholars discover what color Valentine Candy is found more often than any other in a standard bag of Valentine Conversation Hearts. They observe, predict, sort, and classify the data...
Curated OER
Organizing and Understanding Data - Independent Practice
Provide your first graders with an opportunity for independent practice organizing and understanding data. The ten story prompts on this three-page worksheet asks learners to solve problems involving concepts of the total number of...
Curated OER
Digger and the Gang
Help online friends Digger and Sprat from the BBC series to solve math problems! In a series of activities, your class will use data sets to calculate measurements, averages, means, and probabilities. The class completes worksheets and...
Curated OER
Probability
Here is a classic activity used to introduce your class to the concept of probability and data collection. They will roll one die 30 times, then record and discuss the results. Great introduction, but too shallow to be considered a...
Curated OER
Saltwater Science
Students conduct an experiment that shows them how salt water allows things to float. In this salt water lesson plan, students mix ingredients together to create salt water and observe how it makes the oceans dense. They then interpret...
Curated OER
Formation of Rain
Students sequence the steps leading to the formation of rain, and design a model to represent these steps. This task assesses students' abilities to classify, generalize, infer, interpret and communicate data, and construct a pictorial...
Curated OER
Formation of Wind
Students correctly sequence the steps leading to the formation of wind, and describe the cause and effect relationships involved in the formation of wind. This task assesses students' abilities to classify, generalize, infer, interpret...
Curated OER
Quadratic Regression Lab
Students use real temperature data from the Chesapeake Bay, to begin to see some natural mathematical phenomena, and to begin to interpret the data mathematically.
Rice University
Rice University: Web Adventures: Reconstructors: A Plaguing Problem
Online adventure game consisting of five consecutive episodes where you become a member of a team of scientists who investigate pain relieving drugs to see if they are safe. Episodes should be played in order; however, they can be...
University of Texas
Inside Mathematics: Our Pets [Pdf]
This task challenges a student to demonstrate understanding of concepts involved in representing and interpreting data.
National Council of Teachers of Mathematics
The Math Forum: Exploring Ocean Data Lesson Plan
Find "oceans of data" for students of all ages. NCTM, California, and Philadelphia standards are listed for each grade level along with lesson plans and other website resources.
Exploratorium
Exploratorium: Global Climate Change: Research Explorer
Explore scientific data relating to the atmosphere, oceans, areas covered by ice, and living organisms in all these domains. Interpret past and present climate data to predict future climate change and its possible effects.
Texas Instruments
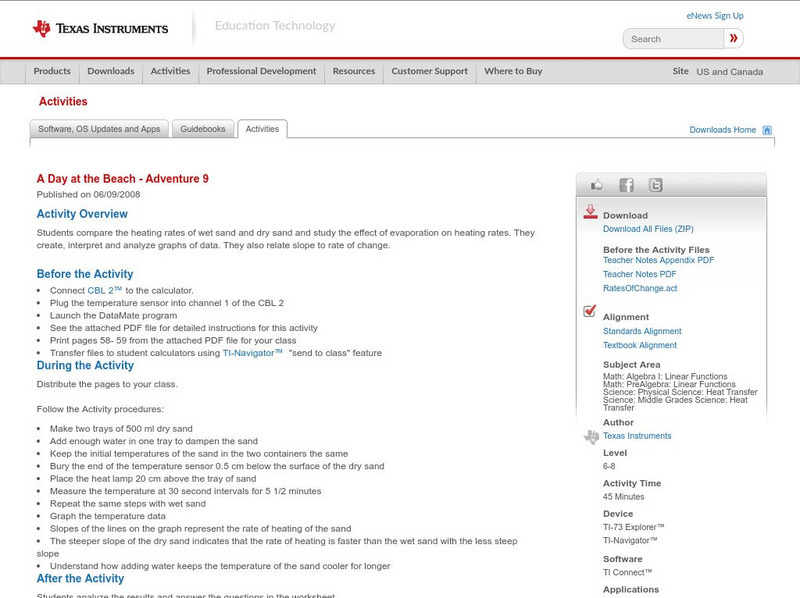
Texas Instruments: A Day at the Beach Adventure 9
Students compare the heating rates of wet sand and dry sand and study the effect of evaporation on heating rates. They create, interpret and analyze graphs of data. They also relate slope to rate of change.
Beacon Learning Center
Beacon Learning Center: Leap Frog Experiment
Students design an experiment, collect information using tree diagrams, and interpret the results using charts in this interactive web lesson.
PBS
Pbs Lesson Plan: Chances Are Talking Probability (Pdf) [Pdf]
An introductory lesson in probability for students in grades three to five. The concepts presented in this lesson are interwoven, over time, into a current unit of study. Kids examine closely the "language" of probability as used in...
Mangahigh
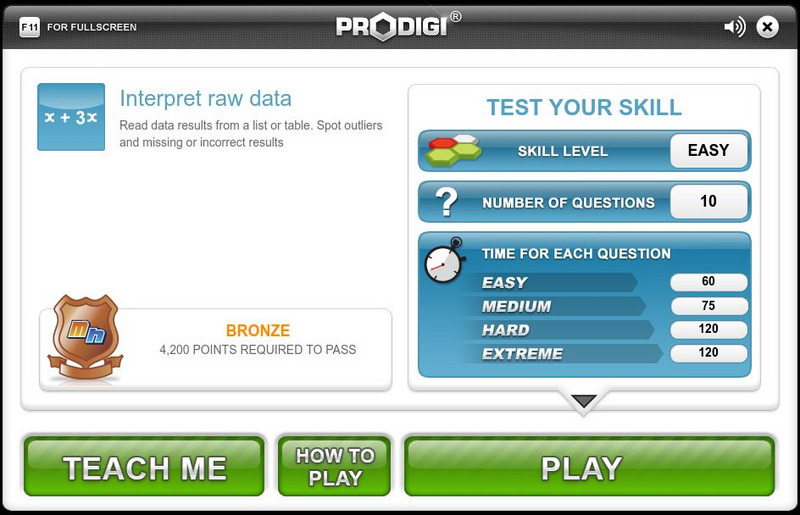
Mangahigh: Data: Interpret Raw Data
Students learn about the concept of interpreting raw data and finding outliers by exploring a tutorial. They can then test their knowledge by taking a ten question assessment that increases in difficulty as they correctly answer questions.


![Inside Mathematics: Our Pets [Pdf] Lesson Plan Inside Mathematics: Our Pets [Pdf] Lesson Plan](https://static.lp.lexp.cloud/images/attachment_defaults/resource/large/FPO-knovation.png)


