Curated OER
Halloween Point Plot
Practice graphing and plotting points with a festive Halloween flair! Scholars plot 21 points on a grid, connecting them to create a spooky shape!
Shodor Education Foundation
Scatter Plot
What is the relationship between two variables? Groups work together to gather data on arm spans and height. Using the interactive, learners plot the bivariate data, labeling the axes and the graph. The resource allows scholars to create...
Math Drills
Halloween Cartesian Art: Witch Hat
What is the mystery picture? After plotting points on the first quadrant of a Cartesian coordinate system, young mathematicians connect the points to create a Halloween-themed picture.
Charleston School District
Analyzing Scatter Plots
Scatter plots tell a story about the data — you just need to be able to read it! Building from the previous lesson in the series where learners created scatter plots, they now learn how to find associations in those scatter plots....
Curated OER
Point Reflection
Use this task as an exit ticket for your eight graders during the geometry unit. All they need to do is identify the coordinates of a point reflected over y=2000.
Do2Learn
Book Report
Tackle the basics of plot with a straightforward book report form. Learners note down the author and title, setting, characters, and basic plot points in any story or book.
Math Worksheets Land
Halloween Cartesian Art: Bat
Get the class batty over graphing. Young mathematicians plot ordered pairs in all quadrants of a Cartesian plane, and connect the points to create a bat.
Math Drills
Christmas Cartesian Art Snowflake
A festive math worksheet hones graphic skills and keeps the season bright! Young mathematicians join points in the order they were graphed to create a snowflake picture.
Inside Mathematics
Snakes
Get a line on the snakes. The assessment task requires the class to determine the species of unknown snakes based upon collected data. Individuals analyze two scatter plots and determine the most likely species for five...
Math Drills
Christmas Cartesian Art Tree
Spruce up graphing practice with an activity that has young mathematicians plot points on a coordinate plane, and then connect the points to create a Christmas tree.
Inside Mathematics
Population
Population density, it is not all that it is plotted to be. Pupils analyze a scatter plot of population versus area for some of the states in the US. The class members respond to eight questions about the graph, specific points and...
Math Drills
Christmas Cartesian Art Santa
Santa has his eye on you in a graphing activity that has young mathematicians plot ordered pairs on a Cartesian plane. After joining the points together, a picture of jolly Santa Claus comes to life.
Charleston School District
Graphing Functions
How do letters and numbers create a picture? Scholars learn to create input/output tables to graph functions. They graph both linear and nonlinear functions by creating tables and plotting points.
K12 Reader
Points on a Coordinate Grid
Introduce your class to the basics of coordinate planes. The reading passage included here describes ordered pairs and the different quadrants on a coordinate grid. Learners read the passage and respond to five related questions.
Shodor Education Foundation
Data Flyer
Fit functions to data by using an interactive app. Individuals plot a scatter plot and then fit lines of best fit and regression curves to the data. The use of an app gives learners the opportunity to try out different functions to see...
Shodor Education Foundation
Graphit
No graphing calculator? No worries, there's an app for that! Young mathematicians use an app to graph functions. In addition, they can also plot data points.
Shodor Education Foundation
Plop It!
Build upon and stack up data to get the complete picture. Using the applet, pupils build bar graphs. As the bar graph builds, the interactive graphically displays the mean, median, and mode. Learners finish by exploring the changes in...
Shodor Education Foundation
Sequencer
Take the first step into graphing sequences. Learners set the starting number, multiplier, add-on, and the number of steps for a sequence. Using the inputs, the interactive calculates and plots the sequence on the coordinate plane. Users...
Nazareth College
Creative Writing
Learners discuss creative writing—what makes something creative writing? Each learner starts writing a story and after 15 minutes, they pass their story to another who adds to it. After another 15 minutes of writing, the story is passed...
Curated OER
Which is Closer to 1?
A seemingly simple question that reveals a lot about a student's understanding of fractions. In finding an answer, learners compare fractions with different denominators that are both greater and less than one. No number line is...
Museum of Disability
Buddy, The First Seeing Eye Dog
Learn about how the seeing eye dog program began with a reading instructional activity about Eva Moore's chapter book, Buddy, The First Seeing Eye Dog. With vocabulary words, discussion questions, and extension resources, the...
Curated OER
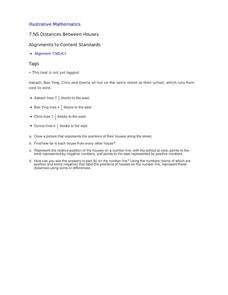
Distances Between Houses
This resource sneaks in the math so your learners will be adding and subtracting positive and negatives on a number line while thinking they are mapping out houses. The activity starts by putting houses the appropriate distance away from...
PBS
Shakespeare & The Renaissance: Activity Ideas
Looking for ways to implement the words and works of William Shakespeare into your curriculum? This list of activity ideas is a great starting point, as it covers a wide range of grade levels and a wealth of online references to explore.
Yummy Math
Deflate-gate
Does temperature affect the air pressure of a football? Young mathematicians look at the readings from a pressure gauge and determine if the balls are within regulation or are under inflated.


