Mariely Sanchez
Story Map
What just happened in that story? Kids can track the plot of any story using this worksheet. They fill in the title, author, and illustrator as well as the setting, characters, major plot points, and their own conclusion about the story.
Novelinks
The Giver: Reading Road Map
Sometimes it's helpful to read certain passages in a novel slowly and carefully, and to read other parts more quickly to move the plot along. Learners tread carefully through Chapter 20 of Lois Lowry's The Giver, noting which...
PBS
Working with Coordinate Planes: Activities and Supplemental Materials
Seven activities make up a collection of supplemental materials to reinforce graphing on a coordinate plane. Worksheet objectives include plotting coordinates within single and four quadrants, measuring straight and...
Santa Ana Unified School District
The Power of Point of View
Sometimes a whole story can change based on the perspective of the person telling it. Practice identifying and analyzing point of view in various reading passages and writing assignments with a language arts packet, complete with Common...
EngageNY
Ordered Pairs
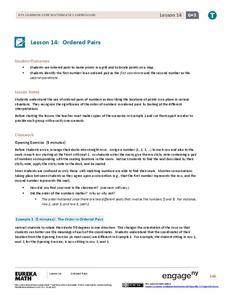
Scholars learn to plot points on the coordinate plane. The lesson introduces the idea that the first coordinate of a coordinate pair represents the horizontal distance and the second coordinate represents the vertical distance.
Mathematics Assessment Project
Bird’s Eggs
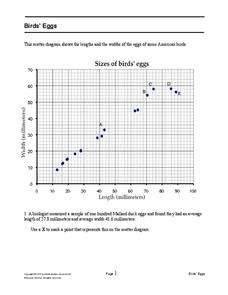
Are the length and width of birds' eggs related? Young ornathologists use a scatter plot to investigate the relationship between the length and width of eggs for Mallard ducks. They then determine the egg with the greatest...
Inside Mathematics
Coffee
There are many ways to correlate coffee to life, but in this case a worksheet looks at the price of two different sizes of coffee. It requires interpreting a graph with two unknown variables, in this case the price, and solving for...
Illustrative Mathematics
The Longest Walk
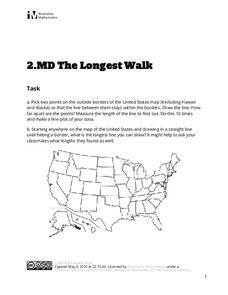
How long of a line can you draw within this activity? Learners pick two points outside and within the map to create the longest line they can. After drawing 10 lines, learners plot the length of each line on a line plot. Then they...
Cassandra Reigel Whetstone
Farmer McPeepers and His Missing Milk Cows
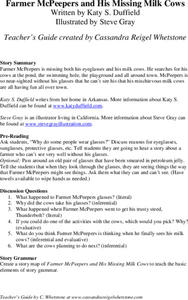
Pair your reading of Farmer McPeepers and His Missing Milk Cows with the questions and activities provided here. Learners answer questions about the text, create story maps, put together brochures, relate math to the story, practice...
Inside Mathematics
Scatter Diagram
It is positive that how one performs on the first test relates to their performance on the second test. The three-question assessment has class members read and analyze a scatter plot of test scores. They must determine whether...
Mathematics Assessment Project
Sugar Prices
Sugar rush! In this assessment task, learners interpret points on a scatter plot representing price versus weight for bags of sugar. They then determine the bag that represents the best value.
Curated OER
Fairy Tales
Once upon a time are four words most children are familiar with when reading a fairy tale. But do they know that fairy tales are a great way to learn the literary elements of reading and writing? Use a thorough fairy tale unit...
Curated OER
Estimating the Mean State Area
Seventh grade statisticians randomly select five states and then determine the mean area. The class then works together to create a dot plot of their results.
Curated OER
Distances Between Houses
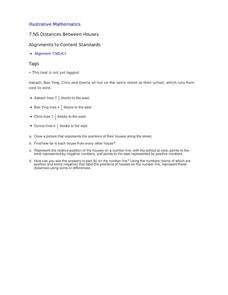
This resource sneaks in the math so your learners will be adding and subtracting positive and negatives on a number line while thinking they are mapping out houses. The activity starts by putting houses the appropriate distance away from...
EngageNY
Distance on the Coordinate Plane
Scholars learn how to find the distance of vertical and horizontal line segments on the coordinate plane in the 19th installment of a 21-part module. The use of absolute value comes in handy.
Noyce Foundation
Snail Pace
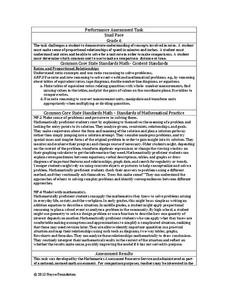
Slow and steady wins the race? In the assessment task, scholars calculate the rates at which different snails travel in order to find the fastest snail. Hopefully, your class will move much more quickly in finishing the task!
EngageNY
Motion Along a Line – Search Robots Again
We can mathematically model the path of a robot. Learners use parametric equations to find the location of a robot at a given time. They compare the paths of multiple robots looking for parallel and perpendicular relationships and...
E-learning for Kids
E Learning for Kids: Math: World of Fish: Position on a Map
Students will play an interactive game to interpret simple maps by describing position, plotting points with coordinates, and drawing and following a path.
Quizlet
Quizlet: 3rd Grade Story Elements and Plot Vocabulary: Flashcards
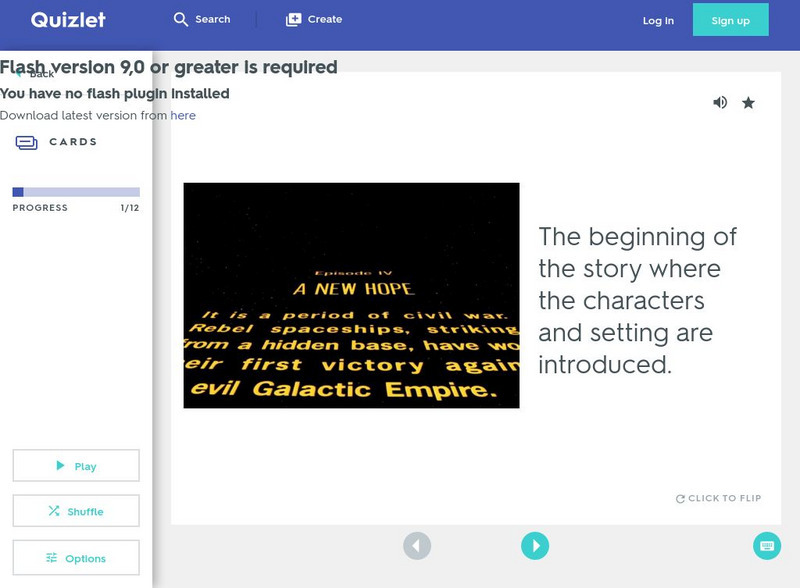
This set of interactive flashcards focuses on story element terms and their definitions. These terms include the following: introduction, setting, characters, conflict, rising action, falling action, point of view, moral, plot, and...
Quizlet
Quizlet: 4th Grade Story Elements and Plot Vocabulary: Match
In this set interactive game, students match story element terms with their definitions. These terms include the following: setting, characters, conflict, rising action, falling action, exposition, protagonist, antagonist, point of view,...
Quizlet
Quizlet: 4th Grade Story Elements and Plot Vocabulary: Flashcards
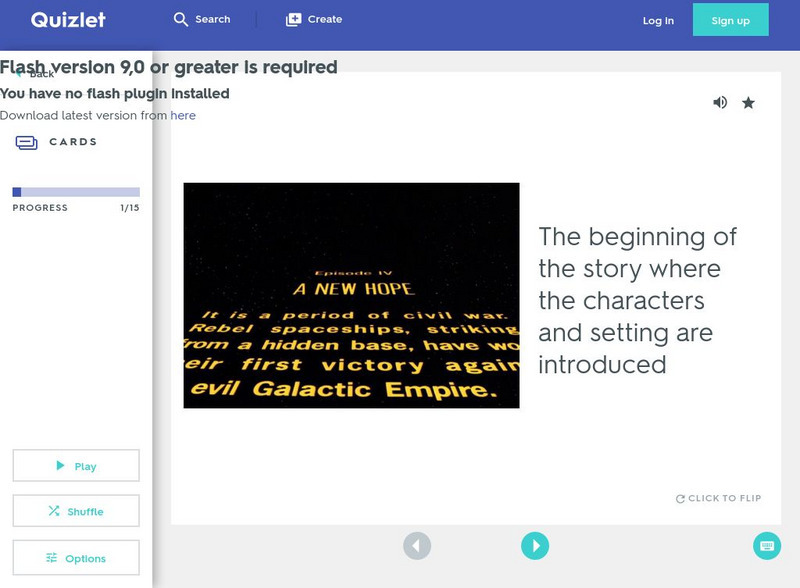
This set of interactive flashcards focuses on the terms and definitions of story elements. These terms include the following: setting, characters, conflict, rising action, falling action, exposition, protagonist, antagonist, point of...
E-learning for Kids
E Learning for Kids: Math: Orange Trees, Olive Trees: Line Graphs
Explore even and odd numbers, fractions, counting, and line graphs with Scott amidst the olive and orange trees.
Illustrative Mathematics
Illustrative Mathematics: 2.md the Longest Walk
In this lesson plan students will measure different points on the map and create a line plot from those measurements.


