University of Missouri
Money Math
Wouldn't your class members love to become millionaires? It doesn't happen overnight. Teach young entrepreneurs about personal finance and money management with a series of lessons focused on money math. Pupils learn about...
Baylor College
Food: The Math Link
Enrich your study of food science with with these math worksheets. They offer a variety of food-related word problems that are great practice for multiplying, identifying fractions, estimating length, and performing calculations...
Federal Reserve Bank
Financial Fables: Shopping Wisely with Olivia Owl
Cover two subjects with one lesson! First, dive into English language arts; read an eBook, answer comprehension questions, and complete a cause and effect chart about the financial fable, Shopping Wisely with Olivia Owl. Then, take...
California Department of Education
I Have “M.I.” Strengths!
There are so many ways to be smart! Can your class identify their intelligences? The third of five career and college lesson plans designed for sixth graders challenges them to assess their unique skills. Once they determine their...
Newspaper Association of America
Power Pack: Lessons in Civics, Math, and Fine Arts
Newspaper in Education (NIE) Week honors the contributions of the newspaper and is celebrated in the resource within a civics, mathematics, and fine arts setting. The resource represents every grade from 3rd to 12th with questions...
EngageNY
Proofs of Laws of Exponents
Apply pupil understanding of exponent properties to prove the relationships. In the sixth activity of the series, individuals are expected to prove relationships using mathematical statements and reasoning.
Illustrative Mathematics
Hours of Daylight 1
The midline of the mathematical model of the number of hours of sunlight is not 12 hours. Pupils use the modeling cycle to determine a function that will model the number of hours of sunlight at a location of their choosing. Using...
Illustrative Mathematics
Weather Graph Data
Teaching young mathematicians about collecting and analyzing data allows for a variety of fun and engaging activities. Here, children observe the weather every day for a month, recording their observations in the form of a bar graph....
Mathematics Vision Project
Module 9: Statistics
All disciplines use data! A seven-lesson unit teaches learners the basics of analyzing all types of data. The unit begins with a study of the shape of data displays and the analysis of a normal distribution. Later lessons discuss the...
Mathematics Vision Project
Module 1: Functions and Their Inverses
Undo a function to create a new one. The inverse of a function does just that. An inquiry-based lesson examines the result of reversing the variables of a function, beginning with linear patterns and advancing to quadratic and...
EngageNY
Measuring Variability for Symmetrical Distributions
How do we measure the deviation of data points from the mean? An enriching activity walks your class through the steps to calculate the standard deviation. Guiding questions connect the steps to the context, so the process...
Scholastic
Food To Go
Molly Mouse and Woovis the Dog are hungry! Can you help them order from a menu with a $5 bill? Kids read five word problems and use the menu to determine what the friends can order.
Shodor Education Foundation
Box Plot
What information can come from a box? Learners choose a data set to display as a box plot and decide whether to include the median in the calculation of the quartiles, show the outliers, and change the scale. To finish the lesson,...
EngageNY
Converting Rational Numbers to Decimals Using Long Division
Convert fractions that cannot be written with a denominator that is a power of 10. Pupils use the definition of a fraction and long division to convert fractions to decimals, then discover that some divisions terminate and others...
Texas Education Agency (TEA)
Geometry in Architecture #1
Discover how to analyze architecture from a geometric standpoint. The fourth installment of an 11-part unit on architecture first provides a presentation on axis, balance, basic form, formal, pattern, proportion, symmetry, and tripartite...
Shodor Education Foundation
Experimental Probability
Spin into a dicey experiment. Pupils use a spinner or a pair of dice to determine the experimental probabilities of each outcome. The interactive allows for either, one, five, or ten consecutive experiments. Using the applet, learners...
Shodor Education Foundation
Measures
Take a look at data from a statistical lens. An interactive allows pupils to enter data set, labeling the data including the units used. Manipulating the applet, learners select the statistics to calculate that include total, mean,...
Shodor Education Foundation
Transmographer
Introducing ... the Transmographer. Young mathematicians investigate translations, reflections, and rotations. The applet lets users perform transformations on triangles, squares, and parallelograms.
Shodor Education Foundation
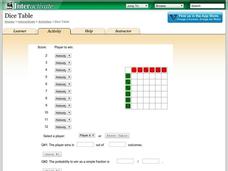
Dice Table
Convert a table to probabilities. Pupils set up the winning rules for the sums of two dice. Using the rules, the applet fills out a table showing the winners for each combination. Learners determine the probabilities of winning for each...
Shodor Education Foundation
Scatter Plot
What is the relationship between two variables? Groups work together to gather data on arm spans and height. Using the interactive, learners plot the bivariate data, labeling the axes and the graph. The resource allows scholars to create...
Shodor Education Foundation
Two Variable Function Pump
Use a function to operate on two variables. Pupils look at operating with complex numbers as a function of two variables. The interactive squares the input and adds a constant to it. Learners visualize the resulting output and its...
Shodor Education Foundation
Vertical Line Test
Connect the points to create a function. Using points given by the applet, pupils try to connect them to create a line that would pass the vertical line test. The resource keeps track of the number of sets the learner is able to identify...
Shodor Education Foundation
Overlapping Gaussians
Adjust the overlap to compare probabilities. Using sliders, learners adjust the shape of two Gaussian curves. The interactive calculates the area of the left tail for one curve and the right tail for the other. Pupils set the interactive...
Shodor Education Foundation
Rabbits and Wolves
A change in a parameter can end in overpopulation. The resources gives pupils the opportunity to control the parameters of rabbits and wolves in a natural setting. Using the set parameters, the simulation runs and displays the population...


