Illustrative Mathematics
Selling Computers
A quick activity to test your learners' knowledge of percent increase. When an electronic store needs a 30% increase in computer sales, your mathematicians must calculate how many computers they need to sell next month.
Georgia Department of Education
Math Class
Young analysts use real (provided) data from a class's test scores to practice using statistical tools. Not only do learners calculate measures of center and spread (including mean, median, deviation, and IQ range), but...
National Council of Teachers of Mathematics
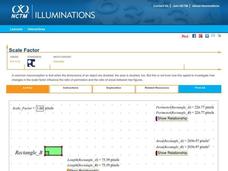
Scale Factor
Does doubling mean everything doubles? Learners adjust the scale factor between two rectangles. Using the calculated measurements, pupils investigate the ratios between the lengths, perimeters, and areas of the rectangles.
Noyce Foundation
Pizza Crusts
Enough stuffed crust to go around. Pupils calculate the area and perimeter of a variety of pizza shapes, including rectangular and circular. Individuals design rectangular pizzas with a given area to maximize the amount of crust and do...
Shodor Education Foundation
Stem and Leaf Plotter
The key is in the leaves. Pupils enter data to create a stem-and-leaf plot. The resource then displays the plot and calculates the mean, median, and mode of the data. Using the plot and the calculated measures of spread, learners analyze...
Noyce Foundation
Which is Bigger?
To take the longest path, go around—or was that go over? Class members measure scale drawings of a cylindrical vase to find the height and diameter. They calculate the actual height and circumference and determine which is larger.
EngageNY
Sampling Variability
Work it out — find the average time clients spend at a gym. Pupils use a table of random digits to collect a sample of times fitness buffs are working out. The scholars use their random sample to calculate an estimate of the mean of the...
Shodor Education Foundation
Graphit
No graphing calculator? No worries, there's an app for that! Young mathematicians use an app to graph functions. In addition, they can also plot data points.
Shodor Education Foundation
Sequencer
Take the first step into graphing sequences. Learners set the starting number, multiplier, add-on, and the number of steps for a sequence. Using the inputs, the interactive calculates and plots the sequence on the coordinate plane. Users...
EngageNY
Polynomial, Rational, and Radical Relationships
This assessment pair goes way beyond simple graphing, factoring and solving polynomial equations, really forcing learners to investigate the math ideas behind the calculations. Short and to-the-point questions build on one another,...
National Research Center for Career and Technical Education
Photoshop Scale
Say cheese! Can your class take a great photo and size it to fit any need? A career and technology-centered lesson plan demonstrates the correct way to resize images in Adobe Photoshop. Scholars view a presentation and work individually...
Magic of Physics
Unit Converter I
Talk about a cool tool! Convert between units with the click of a mouse using a handy online resource. Enter the starting measurement and units for quantities such as torque, speed, and inertia, then sit back and relax while the computer...
Curated OER
All About Money
Few topics engage young mathematicians as much as learning about money. Through a series of shared readings and hands-on activities, children explore the US currency system, learning how to count money and calculate change as they create...
EngageNY
Mental Math
Faster than a speedy calculator! Show your classes how to use polynomial identities to multiply numbers quickly using mental math.
Polar Trec
Beacon Valley Weather
In Beacon Valley, katabatic winds regularly knock fit adults to the ground. The lesson compares the actual temperatures to the wind chill after factoring in katabatic winds in Beacon Valley. Scholars learn to calculate wind chill and...
Baylor College
Body Mass Index (BMI)
How do you calculate your Body Mass Index, and why is this information a valuable indicator of health? Class members discover not only what BMI is and practice calculating it using the height and weight of six fictitious individuals, but...
Chicago Botanic Garden
Are You Bigfoot?
Scholars independently explore several websites to calculate their ecological footprint. Using their new found knowledge, they answer six short-answer questions and take part in a grand conversation with their peers about how...
Noyce Foundation
Ducklings
The class gets their mean and median all in a row with an assessment task that uses a population of ducklings to work with data displays and measures of central tendency. Pupils create a frequency chart and calculate the mean and median....
Shodor Education Foundation
Box Plot
What information can come from a box? Learners choose a data set to display as a box plot and decide whether to include the median in the calculation of the quartiles, show the outliers, and change the scale. To finish the lesson,...
Shodor Education Foundation
Pythagorean Explorer
Make sure the measurement is right. The interactive provides right triangles with a missing side measurement. Pupils use the given sides and the Pythagorean Theorem to calculate the length of the missing side. After entering the length,...
Shodor Education Foundation
Measures
Take a look at data from a statistical lens. An interactive allows pupils to enter data set, labeling the data including the units used. Manipulating the applet, learners select the statistics to calculate that include total, mean,...
Teach Engineering
Microfluidic Devices and Flow Rate
When you have to flow, you have to flow. The activity introduces class members to microfluidic devices and their uses in medicine. They watch a short video on how the diameter affects the rate of flow. The worksheet has individuals...
Shodor Education Foundation
Overlapping Gaussians
Adjust the overlap to compare probabilities. Using sliders, learners adjust the shape of two Gaussian curves. The interactive calculates the area of the left tail for one curve and the right tail for the other. Pupils set the interactive...
Me and My Shadow
Trace My Shadow
Which creates more digital traces: surfing the Internet in a coffee shop, or using an iPhone to send a text message? The answer may surprise you! An interactive resource prompts users to choose which devices, operating systems, and...


