Texas Woman’s University
Patterns, Patterns Everywhere!
Not only is pattern recognition an essential skill for young children to develop, it's also a lot of fun to teach! Over the course of this lesson, class members participate in shared readings, perform small group...
EngageNY
Patterns in Scatter Plots
Class members investigate relationships between two variables in the seventh installment of a 16-part module that teaches scholars how to find and describe patterns in scatter plots. Young mathematicians consider linear/nonlinear...
Virginia Department of Education
Relationships Round Robin
Mathematics is all about patterns. Young mathematicians analyze geometric patterns to write algebraic expressions. They use the expressions to predict future stages of the patterns.
Teach Engineering
Discovering Relationships Between Side Length and Area
Consider the relationship between side length and area as an input-output function. Scholars create input-output tables for the area of squares to determine an equation in the first installment of a three-part unit. Ditto for the area of...
Willow Tree
Linear Relationships
There's just something special about lines in algebra. Introduce your classes to linear equations by analyzing the linear relationship. Young mathematicians use input/output pairs to determine the slope and the slope-intercept formula to...
Mathematics Vision Project
Circles: A Geometric Perspective
Circles are the foundation of many geometric concepts and extensions - a point that is thoroughly driven home in this extensive unit. Fundamental properties of circles are investigated (including sector area, angle measure, and...
Mathematics Vision Project
Similarity and Right Triangle Trigonometry
Starting with similar triangles and dilation factors, this unit quickly and thoroughly progresses into the world of right triangle features and trigonometric relationships. Presented in easy-to-attack modules with copious application...
EngageNY
Writing and Evaluating Expressions—Multiplication and Division
Don't table the resource on writing expressions for relationships in tables. Scholars investigate relationships between variables and write algebraic expressions involving multiplication and division. These expressions help solve...
American Statistical Association
What Fits?
The bounce of a golf ball changes the result in golf, mini golf—and a great math activity. Scholars graph the height of golf ball bounces before finding a line of best fit. They analyze their own data and the results of others to better...
Santa Barbara City College
How to Make a Multiplication Table
Teach children how to make a multiplication table, and they'll be multiplying for life. Following this series of steps, young mathematicians learn to use patterns and the relationships between numbers to create...
Mathed Up!
Straight Line Graphs
Develop graphs by following the pattern. The resource provides opportunities for reviewing graphing linear equations. Pupils create tables to graph linear equations by using patterns whenever possible. The worksheet and video are part of...
Willow Tree
Direct and Inverse Variations
Enhance pupil understanding of proportions and variable relationships by studying direct and inverse variation. Use the idea of a proportional relationship to teach direct variation. Then use a similar pattern to help individuals...
EngageNY
Scatter Plots
Scholars learn to create scatter plots and investigate any relationships that exists between the variables with a lesson that also show them that statistical relationships do not necessarily indicate a cause-and-effect...
EngageNY
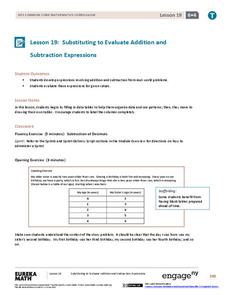
Substituting to Evaluate Addition and Subtraction Expressions
Substitute this resource for what you used to use. Learners identify patterns in data tables and write addition and subtraction expressions to represent relationships. Substitution allows them to solve problems in context in the 20th...
EngageNY
Informally Fitting a Line
Discover how trend lines can be useful in understanding relationships between variables with a lesson that covers how to informally fit a trend line to model a relationship given in a scatter plot. Scholars use the trend line to make...
Virginia Department of Education
Perfecting Squares
Here's a perfect way to introduce perfect squares. Individuals color in the diagonals of squares and record observations about patterns. They connect their diagrams to exponents of two and perfect squares.
EngageNY
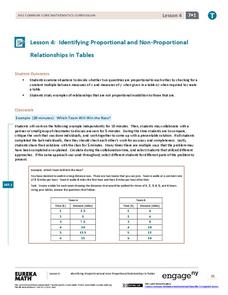
Identifying Proportional and Non-Proportional Relationships in Tables 2
Not all relationships with a pattern are proportional. Show your class why in the fourth installment of a 22-part series. The lesson plan builds upon previous parts and has pupils analyze tables to determine whether they represent a...
San Jose Unified School District
Multiplication Chart
Looking to support your young mathematicians with mastering their multiplication facts? Then this set of multiplication charts is a great place to start, allowing children to visualize the the relationships between factors and multiples.
EngageNY
Nonlinear Models in a Data Context
How well does your garden grow? Model the growth of dahlias with nonlinear functions. In the lesson, scholars build on their understanding of mathematical models with nonlinear models. They look at dahlias growing in compost and...
University of Utah
Functions
Define, explore, compare, and analyze functions with the fourth chapter of a 10-part eighth-grade workbook series. After encountering the definition of a function, pupils begin to explore linear and nonlinear functions. They then...
NASA
Food For Thought
Science can be quite tasty. A delectable unit from NASA shows learners why it's important to consider food, nutrition, and health in space. Four lessons explore the idea in great depth, including testing cookie recipes. Along the way,...
Texas Education Agency (TEA)
Geometry in Architecture #1
Discover how to analyze architecture from a geometric standpoint. The fourth installment of an 11-part unit on architecture first provides a presentation on axis, balance, basic form, formal, pattern, proportion, symmetry, and tripartite...
CK-12 Foundation
Function Rules for Input-Output Tables: Soda Sugar Function Table
Examine the relationship between the input and output variables in a table of values. As learners build an input-output table using online manipulatives, they begin to identify patterns. They answer questions about these patterns...
EngageNY
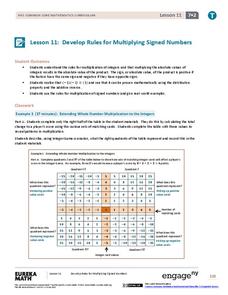
Develop Rules for Multiplying Signed Numbers
Investigate the case of two negatives making a positive. Pupils fill in a quadrant system to generate the products of integers. They analyze the quadrants to find patterns and relationships to help complete the table values. The teacher...
