Curated OER
GSE Foundations of Algebra: Equations and Inequalities
Need lessons on writing and solving one- and two-step linear equations and inequalities, as well as systems of equations? This comprehensive 106-page module from the Georgia Department of Education contains many different lessons for a...
US Department of Commerce
Diversity: Differences in Communities
Using census data, the class finds the percentages of three diversity categories for four states and compare them. With the assistance of a 10 X 10 grid, pupils create visual representations of a comparison between two states on one...
Federal Reserve Bank
Lesson 3: A Fresh Start
The members of your economics class may be busy earning graduation credits, but the credit they should be concerned about is their financial credit. The third lesson in a unit about Hurricane Katrina and other events that can result in...
Math Worksheets Land
Probability of Chance Events - Step-by-Step Lesson
We know a coin should have a 50/50 chance of landing on tails. But what is the probability if it lands 43 out of 83 times? Use the lesson and accompanying resources to teach, practice, and assess about probability of events.
National Research Center for Career and Technical Education
Hospitality and Tourism 2: Costing
The lesson plan provides a richly detailed narrative and sample problems for teaching or reinforcing how to work with percentages. In particular, your audience will compute the costs per serving of food and simulate setting menu prices...
Curated OER
Using Random Sampling to Draw Inferences
Emerging statisticians develop the ability to make inferences from sample data while also working on proportional relationships in general. Here, young learners examine samples for bias, and then use random samples to make...
Newspaper Association of America
By the Numbers: Mathematical Connections in Newspapers for Middle-Grade Students
A cross-curricular resource teaches and reinforces mathematical concepts with several activities that use parts of a newspaper. Scholars use scavenger hunts to find the different ways math is used in the paper along with using data...
Virginia Department of Education
May I Have Fries with That?
Not all pie graphs are about pies. The class conducts a survey on favorite fast food categories in a lesson on data representation. Pupils use the results to create a circle graph.
CK-12 Foundation
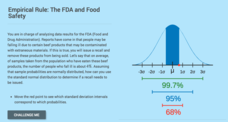
Computing Probabilities for the Standard Normal Distribution: The FDA and Food Safety
To recall or not to recall, that is the question. Using provided data, pupils calculate the percent of people that may fall ill on average. The scholars determine the standard deviation based upon the mean and the empirical rule,...
Math Worksheets Land
Find Percentages of Numbers - Step-by-Step Lesson
Finding a percentage of a number is a skill learners must know in order to be successful thinkers. The resource introduces this concept with a guided explanation and can be used with the additional materials as a...
Federal Reserve Bank
So How Much Are You Really Paying for that Loan?
Loans are rarely provided without a cost. Pupils evaluate the high cost of using a payday loan or payday advance through discussion and worksheets, and finally work in groups to develop short public service announcements...
Math Worksheets Land
Patterns of Association (Using Data Tables) - Guided Lesson
The worksheet belongs to a four-part resource that applies percentages to data tables. The page has three practice problems that continues with the development of this topic.
Education World
The African American Population in US History
How has the African American population changed over the years? Learners use charts, statistical data, and maps to see how populations in African American communities have changed since the 1860s. Activity modifications are included to...
National Research Center for Career and Technical Education
Business Management and Administration: Compound Interest - A Millionaire's Best Friend
Many math concepts are covered through this resource: percentages, decimals, ratios, exponential functions, graphing, rounding, order of operations, estimation, and solving equations. Colorful worksheets and a link to a Google search for...
West Contra Costa Unified School District
Interest and the Number e
Mary, Mary, quite continuously, how does your money grow? Uses examples to examine the difference between simple interest and compound interest, and to take a look at different rates of compounding. Learners explore what would...
Science Geek
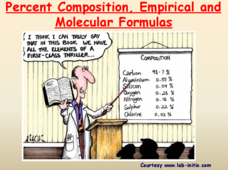
Percent Composition, Empirical and Molecular Formulas
Help your pupils understand when empirical becomes molecular. The lesson presentation demonstrates the connection between empirical formulas and molecular formulas. Then, given percent composition, the lesson demonstrates the steps to...
West Contra Costa Unified School District
Simplifying Fractions Activity
Warm-up pupils' fraction muscles with a four-question quiz, then delve into a learning game designed to reinforce the concept of simplifying fractions. Based on the "I do, We do, You do" method of teaching, the lesson directly...
EngageNY
Writing, Evaluating, and Finding Equivalent Expressions with Rational Numbers 2
The 20th segment in a series of 25 has learners work with percentage problems to generate equivalent expressions. Pupils find discounted prices using numerical and algebraic expressions. The task then requires individuals to find the...
EngageNY
The Scale Factor as a Percent for a Scale Drawing
Scholars build upon their knowledge of scale drawings by using percents to represent the scale factor. Individuals work with scaling in vertical, horizontal, and both directions.
National Research Center for Career and Technical Education
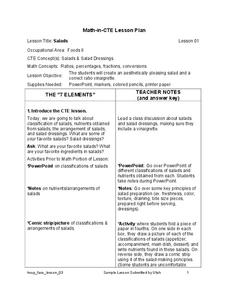
Salads
Lettuce talk for a moment about your culinary scholars; do they have what it takes to create a great salad? Show them the finer points of salad preparation with a career and technology lesson that combines direct instruction, creativity,...
Willow Tree
Weighted Averages
Mixtures, weighted percentages, and varying speeds make problem solving difficult. The resource give learners a strategy for tackling these types of problems effectively.
Virginia Department of Education
Rational Speed Matching
Ready, set, go! Individuals practice converting rational numbers between fractions, decimals, and percents. A speed game has teams match the three forms of rational numbers on a number line.


