West Contra Costa Unified School District
Average Rate of Change
The concept of slope gets an approachable, yet theoretical, treatment in a comprehensive algebra lesson. The use of functional notation and problem-solving techniques keep the material rigorous, but detailed teaching notes and lots of...
EngageNY
Graphs of Simple Nonlinear Functions
Time to move on to nonlinear functions. Scholars create input/output tables and use these to graph simple nonlinear functions. They calculate rates of change to distinguish between linear and nonlinear functions.
Flipped Math
Calculus AB/BC - Using the Mean Value Theorem
At some point the rate of change must be the average. Pupils first see the definition of the Mean Value Theorem and hear an explanation of it in simple terms. The helpful video then compares the Mean Value Theorem with the Intermediate...
Howard Hughes Medical Institute
Spreadsheet Tutorial 1: Formulae, Functions, and Averages
Spread your knowledge of spreadsheets. The first of five tutorials in the Spreadsheet Data Analysis unit introduces the basics of spreadsheets. It shows future data analysts how to organize and format tables, and how to use functions to...
West Contra Costa Unified School District
Average Rate of Change
Learners investigate average rates of change for linear functions and connect the concept to slope. They then determine average rates of change in quadratic and exponential functions.
Flipped Math
Calculus AB/BC - Estimating Derivatives of a Function at a Point
It seems like it should be about three. Pupils learn to get an estimate of the derivative of a function at a point by using the derivative functionality of their graphing calculators. They take that information to determine the equation...
College Board
Reasoning from Tabular Data
Don't table the resource—use it now. An AP® Calculus curriculum module encourages the use of tabular data throughout the course. It provides some example topics, such as rate of change, net change, and average value of a function, where...
Rice University
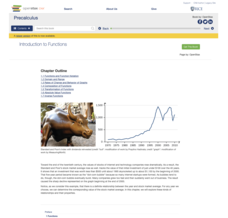
Precalculus
Take a step beyond Algebra 2. Learners use the eBook to learn concepts from the typical Precalculus course. Content starts off with a short review of functions in general and moves on to the basic functions, finishing up with more...
EngageNY
Analyzing a Graph
Collaborative groups utilize their knowledge of parent functions and transformations to determine the equations associated with graphs. The graph is then related to the scenario it represents.
Virginia Department of Education
Linear Modeling
An inquiry-based algebra lesson explores real-world applications of linear functions. Scholars investigate four different situations that can be modeled by linear functions, identifying the rate of change, as well as the strength and...
Mathematics Vision Project
Quadratic Equations
Through a variety of physical and theoretical situations, learners are led through the development of some of the deepest concepts in high school mathematics. Complex numbers, the fundamental theorem of algebra and rational exponents...
Willow Tree
Line Graphs
Some data just doesn't follow a straight path. Learners use line graphs to represent data that changes over time. They use the graphs to analyze the data and make conclusions.


