Yummy Math
Playing with my calculator on the 4th of July
This fun activity guides learners through an exploration of the effects of replacing f(x) with -f(x), f(x) + c, k f(x), and f(x + c). Using graphing calculators, students experiment with variations of the graph of y = x^2 to design a...
Wordpress
Introduction to Exponential Functions
This lesson begins with a review of linear functions and segues nicely over its fifteen examples and problems into a deep study of exponential functions. Linear and exponential growth are compared in an investment task. Data tables are...
Annenberg Foundation
Skeeters Are Overrunning the World
Skeeters are used to model linear and exponential population growth in a wonderfully organized lesson plan including teachers' and students' notes, an assignment, graphs, tables, and equations. Filled with constant deep-reaching...
NASA
Geographical Influences
"If global warming is real, why is it so cold?" Distinguishing the difference between weather and climate is important when it comes to understanding our planet. In these activities, young scientists look at the climate patterns in a...
Saxon
Plotting Functions
Youngsters use a graphing calculator to assist in creating a function table. They graph the function on a coordinate plane. They explore the relationship between the domain and range in the graph. This four-page worksheet contains two...
Utah Education Network (UEN)
Finding Slope of a Line from Graphs, Tables, and Ordered Pairs
Middle schoolers explore the concept of slope in numerous ways and start to look at simple linear equations. They describe the slope in a variety of ways such as the steepness of a line, developing a ratio, using graphs, using similar...
Illustrative Mathematics
Puzzle Times
Give your mathematicians this set of data and have them create a dot plot, then find mean and median. They are asked to question the values of the mean and median and decide why they are not equal. Have learners write their answers or...
National Math + Science Initative
Using Linear Equations to Define Geometric Solids
Making the transition from two-dimensional shapes to three-dimensional solids can be difficult for many geometry learners. This comprehensive Common Core lesson plan starts with writing and graphing linear equations to define a bounded...
Illustrative Mathematics
Puppy Weights
Nobody can say no to puppies, so lets use them in math! Your learners will take puppy birth weights and organize them into different graphs. They can do a variety of different graphs and detail into the problem based on your classroom...
Texas Instruments
TI-Nspire™ CAS
When it comes to rating educational calculators, this calculator is always near the top of this list. Now it's available as an app. There is a lot of calculator power wrapped up in this app. Not only is this a fully functioning...
Texas Instruments
TI-Nspire™
We landed on the moon with less computing capabilities than you can find in this app! Here is a multiple function calculator that takes all the power you get from a handheld and adds the wonderful large screen that only a tablet can...
Curated OER
Graphing Inequalities in Two Variables
This study guide is a great resource to help you present the steps to graphing linear inequalities. Show your class two different ways to graph an inequality and work on a real-world example together. The document could also be easily...
Texas Instruments
Function Notation - Texas Instruments
Using a TI-Nspire calculator, learners will work to better understand function notation and input/output functions. They write equations with a function symbols, identify what makes an equation a function, and graph lines in order to...
Curated OER
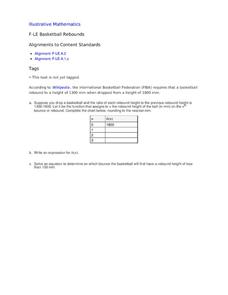
Basketball Rebounds
Your young basketball players will build a table and develop a general formula for a decaying exponential scenario involving the rebound distance of a bouncing ball. Using a CBR and graphing calculator can make this even more hands-on...
Illustrative Mathematics
Electoral College
A cross-curricular resource that takes the electoral votes and allows your learners to organize and analyze the data. Young voters can determine which states are more influential and interpret the dotplot provided for more data....
Illustrative Mathematics
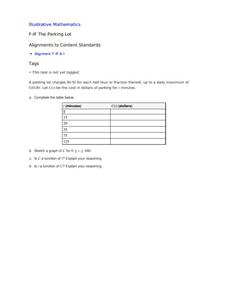
The Parking Lot
Use the real-world cost of parking a car to demonstrate the properties of a function. The resource describes to learners how much it is to park in a certain lot. It is up to your number crunchers to complete a table of minutes and...
Illustrative Mathematics
Chicken and Steak, Variation 2
Many organizations put on barbecues in order to make money. In a real-world math problem, the money allotted to purchase steak and chicken at this barbecue is only one hundred dollars. It is up to your potential chefs to figure out how...
Curated OER
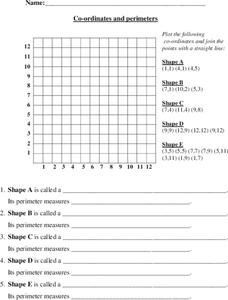
Coordinates and Perimeters
Here is a lesson containing a great activity based on coordinates, and the perimeters of shapes created using a given set of coordinates. After youngsters creat a shape on a grid based on some coordinate pairs, they must identify which...
Curated OER
Can You Measure Up?
Here is a well-designed lesson plan on common standards of measurement for your young mathematicians. In it, learners calculate measurements in standard and non-standard units. They make predictions, record data, and construct and design...
National Security Agency
It's Probably Probable
Learners make predictions and draw conclusions from given information as they learn the meaning of probability in this vocabulary-rich, integrated activity that presents a variety of teaching strategies to motivate and reach all learning...
Curated OER
Access Ramp
Just about every public building that your high schoolers are familiar with has an access ramp which complies with ADA requirements. As it turns out, designing such a ramp is an excellent activity to incorporate slope, the Pythagorean...
Curated OER
Polynomials and Linear Factors
This algebra instructional activity reviews writing polynomials in standard form from factored form, looks at the graphs of polynomials of degree higher than two, and identifies the zeros of polynomials using the Factor Theorem and...
Curated OER
Mathemafish Population
It's shark week! In this problem, young mathematically minded marine biologists need to study the fish population by analyzing data over time. The emphasis is on understanding the average rate of change of the population and drawing...
Curated OER
Linear Programming
Students explore inequalities to determine the optimal solution to maximize a profit for a company. In this linear programming lesson, students discover how to graph inequalities and how to determine the algebraic representation of a...
Other popular searches
- Graphing Calculator and Math
- Algebra Graphing Calculators
- Graphing Calculator Math
- Graphing Calculator Skills
- Graphing Calculator Squares
- Graphing Calculator Lessons
- Graphing Calculator Parabola
- Graphing Calculators Ti 83
- Graphing Calculator Activities
- Graphing Calculator Worksheet
- Ti 84 Graphing Calculator


