Math Worksheets Land
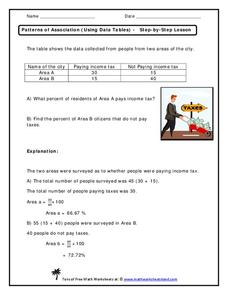
Patterns of Association (Using Data Tables) - Step-by-Step Lesson
This worksheet belongs to a four-part resource that gathers information from data tables to calculate percentages. The page introduces one problem and shares an explanation to the answer.
Math Worksheets Land
Patterns of Association (Using Data Table) - Matching Worksheet
This resource is the last of a four-part series that practices calculating percents based on data represetned in tables. This page has four multiple choice problems that analyze the data tables to answer a question.
Math Moves U
Collecting and Working with Data
Add to your collection of math resources with this extensive series of data analysis worksheets. Whether your teaching how to use frequency tables and tally charts to collect and organize data, or introducing young mathematicians to pie...
Curated OER
Drive the Data Derby
Three days of race car design and driving through the classroom while guessing probability could be a third graders dream. Learn to record car speed, distances traveled, and statistics by using calculation ranges using the mean, median,...
Virginia Department of Education
Atomic Structure: Periodic Table
The fifth lesson of seven in the series outlines an in-depth analysis of the periodic table. After direct instruction, pupils take turns practicing in the group before beginning independent study. The assessments include a quiz and an...
Wordpress
Introduction to Exponential Functions
This lesson begins with a review of linear functions and segues nicely over its fifteen examples and problems into a deep study of exponential functions. Linear and exponential growth are compared in an investment task. Data tables are...
Curated OER
Data Display
Students explore different ways to display data. In this statistics instructional activity, students create pie charts, bar graphs and line graphs to show data. Students then write a paragraph discussing which types of graphs are helpful...
Math Drills
Valentine's Day Ordering and Comparing (B)
Discover this Valentine's Day-themed worksheet where young mathematicians answer word problems using data tables.
Curated OER
"Data Dabble"
Students engage in a lesson which facilitates their use of web sites to find data, graph it, and interpret it, thus scaffolding graphing skills to prepare students for their 8th grade I-search exit project.
Curated OER
Graph a Situation by Making a Table
Learners graph scenarios values by making a table. In this algebra lesson, students rewrite word problems using algebraic symbols. They make a table of the data, make a graph and analyze the data to extrapolate.
Curated OER
More Graphing Situations by Making a Table
Students calculate rate of change and graph linear functions. In this algebra instructional activity students write linear functions, make a table of points and graph their data on a coordinate plane. They calculate the rate of change of...
Curated OER
Creating a Thematic Map
Students create and analyze a weather-related data table and a thematic map based upon information provided.
Curated OER
Learning to Make Line Graphs
Students analyze data and create a line graph. In this graphing lesson, students explore data from a previous experiment and plot the information on a line graph. Students analyze their findings.
Mathematics Assessment Project
Interpreting Distance–Time Graphs
Pre-algebra protégés critique a graph depicting Tom's trip to the bus stop. They work together to match descriptive cards to distance-time graph cards and data table cards, all of which are provided for you so you can make copies for...
Curated OER
Data Scavenger Hunt
Eighth graders discuss how data is collected and participate in data collection through a survey. They complete a scavenger hunt on the Internet to gain understanding of the data measures mean, median, mode, and range.
US Department of Agriculture
Sink or Float?
Will it sink or will it float? Learners predict the outcome as they drop random objects into a container of water. Then, they keep track of the results and record the data in a t-chart to draw a final conclusion.
CCSS Math Activities
Smarter Balanced Sample Items: 8th Grade Math – Target J
Look at patterns in bivariate data. Eight sample items illustrate the eighth grade statistics and probability standards. The Smarter Balanced Sample multiple-choice items focus on numerical and categorical bivariate data. The slide show...
American Statistical Association
Bear Hugs
Scholars research arm span to determine who gives the best bear hugs. They use data from a national study to find the standard statistics for arm span. It includes mean, median, quartiles, spread, standard deviation, and more.
CCSS Math Activities
Smarter Balanced Sample Items: 6th Grade Math – Target G
Making money and saving money turn into high interest topics for sixth graders. Grade 6 Claim 1 Item Slide Shows use these topics in a presentation with math practice problems. The questions require applying knowledge of algebraic...
Curated OER
Handling Data
Students create a simple table in order to solve a problem. As a class, they create a simple data table in order to discover the number of letters in each student's name. This data is interpreted in order to answer questions and make...
Raytheon
Data Analysis and Interpretation
For this data analysis and interpretation worksheet, learners use charts, graphs, statistics to solve 42 pages of problems with answer key included.
Curated OER
Weather, Data, Graphs and Maps
Learners collect data on the weather, graph and analyze it. For this algebra lesson, students interpret maps and are able to better plan their days based on the weather reading. They make predictions based on the type of clouds they see.
Curated OER
Interpreting Data and Building Hypothesis
Students define the term species, and graph species data together with previously collected data at the National Zoo. They interpret graphed data and recognize patterns in the streamside quadrant versus hillside quadrant. Students use...
Chicago Botanic Garden
Historical Climate Cycles
What better way to make predictions about future weather and climate patterns than with actual climate data from the past? Young climatologists analyze data from 400,000 to 10,000 years ago to determine if climate has changed over time....


