Chicago Botanic Garden
Recognizing Change (Observation vs. Inference)
What is the difference between making inferences and making observations? Young climatologists refer to a PowerPoint to make observations on each slide. They record their observations in a provided worksheet before drawing a...
Curated OER
Observation and Inference
Assess your young scientists' understanding of the difference between observation and inference with this 20-question multiple choice quiz. It reviews a variety of physics and astronomy concepts, such as solar eclipses and sunspots, the...
Have Fun Teaching
Making Inferences (6)
The story of Petey and Ralphie provides readers with the perfect opportunity to practice using clues in a text to draw inferences. The questions that follow the story direct readers' attention to details that imply rather than directly...
Greater Clark County Schools
Observations and Inferences
A cartoon from the far side of Gary Larsen's wacky world provides an opportunity for critical thinkers to practice their skills distinguishing between observations and inferences. What fun.
Curated OER
Learning Inference
Making inferences can be a tricky proposition for middle schoolers. In the lesson presented here, pupils practice the skill of drawing a conclusion and making a judgment - which are what making an inference is all about! There are five...
K5 Learning
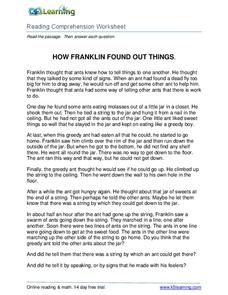
How Franklin Found Out Things
Franklin learns about the world by making observations, and so do we! A short reading assignment prompts fourth graders to answer comprehension questions about a curious boy and what he notices.
Curated OER
A is for . . .
Students discuss the difference between making inferences and observations. They practice making observations and inferences regarding an apple.
Curated OER
Weather Observation Journal
Students record weather for a period of one month. In this weather lesson, students observe weather for one month on a large pictograph. Students record clouds, wind, temperature and any other weather conditions they observe. Students...
Curated OER
Crickets Guided Discovery
Sixth graders investigate insect anatomy by analyzing a live cricket. In this insect science lesson, 6th graders discuss their knowledge of insects and describe their characteristics from memory. Students observe live...
Curated OER
Simple Machines
Students investigate simple machines. In this simple machines lesson plan, students construct two simple machines and describe what they do. Students show that simple changes help machines do work with less effort. Students use a paper...
Curated OER
Can You See It, Touch It, Hear It?
Students develop and practice observational skills through lab activity.
Curated OER
Classification of Animals
Students identify observable features of eight dinosaurs and create a sorting chart using SMART Notebook on a SMART Board (or, in case you do not have a SMART Board, a chalk or dry-erase board).
Curated OER
Rocks on Parade!
Third graders describe and classify rock samples. In this rock lesson, 3rd graders make inferences about rock samples by observing and measuring them. This lesson contains 5 different stations for the students to go to.
Curated OER
Energy Transformation
Students experiment with variety of materials to investigate, develop inferences, and differentiate between concepts of motion energy and heat energy, and the part played by friction in the transformation process.
Curated OER
Teaching and Learning Through Objects
Students identify and interpret the function, usefulness or utitlity, form, beauty or aesthetics, and meaning, context or story, of objects and how they learn new skills and make things that they learn traditionally, by observation and...
American Statistical Association
Exploring Geometric Probabilities with Buffon’s Coin Problem
Scholars create and perform experiments attempting to answer Buffon's Coin problem. They discover the relationships between geometry and probability, empirical and theoretical probabilities, and area of a circle and square.
Curated OER
Organizing Data Using Tables and Graphs
Students create graphs and tables, as well as interpret and make inferences from the data shown to determine when and where graphs and tables are most useful.
Curated OER
Hero Or Zero?
Learners investigate science and technology by reading a children's book. In this reading comprehension lesson, students read the story Archibald Frisby and discuss the ways we use science and technology in everyday life....
Curated OER
Science in baseball
Sixth graders examine how science is used in everyday activities, such as baseball.
Curated OER
Basic Excel
Students explore basic Excel spreadsheets. In this spreadsheet lesson plan, students enter Alaska weather information and perform calculations. Students title the columns on the spreadsheet and format the cells. ...
National Wildlife Federation
Get Your Techno On
Desert regions are hotter for multiple reasons; the lack of vegetation causes the sun's heat to go straight into the surface and the lack of moisture means none of the heat is being transferred into evaporation. This concept, and other...
Curated OER
Introducing Topographic Maps: Guiding Students from Concrete Models to Graphic Representations
Students interpret topographic maps and infer human activity as it is influenced by the landscape.
American Statistical Association
Happy Birthday to . . . Two?
How many people do you need in a room before two likely share the same birthday? Scholars consider this puzzle by analyzing a set of data. They ponder how to divide the data and determine the proper size of a group for this event to...
NTTI
Vectors: Traveling, But in What Direction
High schoolers watch a video of real-world situations regarding speed, direction, velocity, force, etc. and answer questions while viewing. They then practice drawing and using vectors to solve more real-world problems.
Other popular searches
- Observation Inference
- Observation and Inference
- Observation Inference Lab
- Observation vs Inference
- Observation Inference Demo
- Observation vs. Inference
- Observation Inference Science


