Curated OER
Learning About A Graphing Calculator
Students investigate the use of a graphing calculator in solving problems. In this algebra lesson, students solve polynomials problems using a calculator.
Inside Mathematics
Graphs (2006)
When told to describe a line, do your pupils list its color, length, and which side is high or low? Use a worksheet that engages scholars to properly label line graphs. It then requests two applied reasoning answers.
Curated OER
Exploring Graphs
Learners are introduced to connecting graphing in a coordinate plane to making scatterplots on a graphing calculator. Working in pairs, they connect points plotted to make a sailboat and complete questions on a worksheet as well as plot...
Curated OER
Probability Experiment Simulation: Design and Data Analysis Using a Graphing Calculator
Seventh graders simulate probability experiments. Using a graphing calculator, 7th graders design, conduct, and draw conclusions from simulations or probability experiments. Students construct frequency tables and compare the...
Curated OER
Exploring Quadratic Data with Transformation Graphing
Using a data collection device to collect data regarding a bouncing ball, students use various features on graphing calculators to experiment with the parameters of the vertex form of the parabola and their effect on the shape of the...
Curated OER
Graphing Exponentials
Bring your Algebra class to the computer lab! Using materials created by Texas Instruments, they explore exponentiasl and graphs. Be sure to download the correct materials (on the right side of the webpage) before having them walk...
Shodor Education Foundation
Function Flyer
Fly through graphing functions with the Function Flyer. Young mathematicians use an interactive to graph different types of functions. A set of exploration questions has users investigate patterns in functions.
Curated OER
What's in a Graph?
Students explore how to use and interpret graphs. The graphs are pulled from a variety of sources, and the activities ask students to interpret graphs. They start this lesson plan with knowledge of what a graph is. Students also know how...
Curated OER
Making Connections: Matrices, Graph, Linear Systems
In this set of activities, matrices and equations are explored. They work with matrices using pen and paper as well as graphing calculator. Additionally real-world problems are explored.
Curated OER
Interpreting Graphs
Sixth graders interpret linear and nonlinear graphs. They create graphs based on a problem set. Next, they represent quantitive relationships on a graph and write a story related to graphing.
Curated OER
Graphing Linear Equations on the TI-73
Eighth graders work in pairs with a TI-73 graphing calculator to complete a multiple-choice review using the Classroom Performance System. Each team uses a remote unit to "click in" the answers. When all teams have completed the review,...
Texas Instruments
Graphs of Rational Functions
Take your kids on a tour of graphing rational functions. Using this TI lesson, high schoolers identify the end behavior of their functions. They find the domain and range, describe end behavior, and look at asymptotes and restrictions of...
Chicago Botanic Garden
Micro-GEEBITT Climate Activity
A truly hands-on and inquiry based learning activity bridges all the lessons in the series together. Beginning with a discussion on average global temperatures, young meteorologists use real-world data to analyze climate trends in order...
American Statistical Association
What Fits?
The bounce of a golf ball changes the result in golf, mini golf—and a great math activity. Scholars graph the height of golf ball bounces before finding a line of best fit. They analyze their own data and the results of others to better...
Curated OER
Writing Equations of Parabolas in Vertex Form
Pupils use their knowledge of the vertex form of a quadratic equation to graph parabolas using a graphing calculator, given a specific move to make. this lesson may be used as a review or as extra practice, in groups or individually.
Virginia Department of Education
Graphing Systems of Inequalities
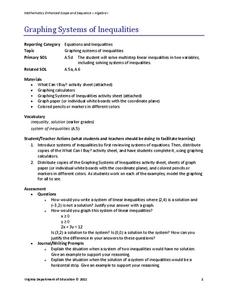
Apply systems of inequalities to a real-world problem. Here, scholars learn to graph solutions to systems of linear inequalities. To finish the lesson, they solve a problem involving burgers and cheeseburgers using a system of inequalities.
Curated OER
What's My Pattern?
Learners recognize, describe and extend patterns in three activities. They organize data, find patterns and describe the rule for the pattern as well as use the graphing calculator to graph the data to make and test predictions. In the...
Saxon
Plotting Functions
Youngsters use a graphing calculator to assist in creating a function table. They graph the function on a coordinate plane. They explore the relationship between the domain and range in the graph. This four-page worksheet contains two...
PBS
Working with Coordinate Planes: Activities and Supplemental Materials
Seven activities make up a collection of supplemental materials to reinforce graphing on a coordinate plane. Worksheet objectives include plotting coordinates within single and four quadrants, measuring straight and...
Curated OER
Investigating Linear Equations Using Graphing Calculator
Young scholars investigate linear equations using the Ti-Calculator. For this algebra lesson, students graph lines and identify the different quadrants on a coordinate plane. They identify ordered pairs used to plot lines.
Illustrative Mathematics
Graphs of Power Functions
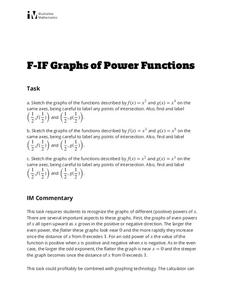
This activity consists of three exercises in which learners sketch the graphs of various power functions on the same axes. They use their sketches to make comparisons and observations which lead to generalizations about the graphs...
Curated OER
Graphing Linear Equations Cards
OK, so maybe graphing linear equations can be fun. This activity includes a set of linear equation cards to be cut and place face up on a table. Learners pick a card and match it to the correct graph card. This is a really fun way to...
Polar Trec
How Much Data is Enough?
The next time you read a magazine or watch the news, make note of how many graphs you see because they are everywhere! Here, scholars collect, enter, and graph data using computers. The graphs are then analyzed to aid in discussion of...
Curated OER
Button Bonanza
Collections of data represented in stem and leaf plots are organized by young statisticians as they embark some math engaging activities.


