National Wildlife Federation
The Tide is High, but I’m Holding On… Using ICESat Data to Investigate Sea Level Rise
Based on the rate of melting observed from 2003-2007 in Greenland, it would take less than 10 minutes to fill the Dallas Cowboys' Stadium. The 17th lesson in a series of 21 has scholars use the ICESat data to understand the ice mass...
Curated OER
Energy Audit
Young scholars collect data about energy usage and use mathematical calculations to analyze their data. In this energy conservation and statistics math lesson, students survey their homes to complete an energy usage worksheet. Young...
NOAA
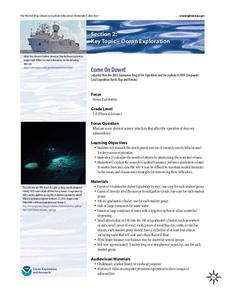
Come on Down!
What do we do when a dive is too dangerous for humans to accomplish? Send in the robots! Middle school scientists get acquainted with several different models of submersible robots in the second lesson of six from NOAA. Lab groups then...
National Wildlife Federation
Wherefore Art Thou, Albedo?
In the sixth instructional activity in a series of 21, scholars use NASA data to graph and interpret albedo seasonally and over the course of multiple years. This allows learners to compare albedo trends to changes in sea ice with...
Curated OER
All in the Family: Calculating Cousins
Students view pictures of distant "cousins" to humans. They place them in order by their distance from humans. Students receive a packet of six pages featuring graphics and a cousins summary page. They work in groups to complete 5 cousin...
Curated OER
Calculating Population Growth for a Region
Students research population growth of regions of Canada. In this Social Studies lesson, students use included links on the Internet to find information about population growth in areas of Canada. A worksheet for each region is included....
Curated OER
What Does It Cost to Use It?
Students investigate how electrical usage is counted. In this electricity lesson, students research an electric bill and define terms such as watts and kilowatts. Students calculate the average electricity cost per year by using a...
Partnership for Educating Colorado Students
Mayan Mathematics and Architecture
Take young scholars on a trip through history with this unit on the mathematics and architecture of the Mayan civilization. Starting with a introduction to their base twenty number system and the symbols they used, this eight-lesson unit...
Chicago Botanic Garden
Impacts of Climate on Forest Succession
Part two in a series of four explores the effects of climate on succession or the changing of plant species in a forest. Groups review how to identify trees and then spend a day in the field collecting extensive data on trees to...
Curated OER
Interest Rates
Use a KWL chart and discussion to explore the concept behind loans with interest based on percentage rates. Learners examine different types of interest, the history of interest loans and calculate the costs of a loan over a ten-year...
National Wildlife Federation
I’ve Got the POWER Wind Energy Potential at Your School
The 20th lesson in a 21-part series connects the wind data and expectations of a turbine to whether such devices should be built in your area. Scholars begin with estimating the wind potential at school by using long-term climate...
Curated OER
Inside OKCupid: The Math of Online Dating
Capture the hearts of your young statisticians with this real-life example of using statistics in online dating. The use of average and geometric mean are discussed in the context of creating the algorithm used to connect people.
Curated OER
Computer Graphing Calculator Explorations
Pupils explore the graphing calculator feature on the Macintosh computer to explore some "parent" functions and their translations, combinations, and composites.
University of Rhode Island
How Does the Human Body Use Energy during Various Athletic Activities?
Students investigate how much energy is used during different athletic activities. They conduct Internet research to obtain information on the top three athletic sporting events from around the world, and calculate the calories burned...
Curated OER
Using a Spreadsheet to Understand Density
Students use density to identify what metal a gold colored weight is made of. They use a spreadsheet to graph the experimental density of common metals and compare the know densities to their calculated density of the known metal.
Curated OER
Using Excel To Teach Probability And Graphing
Students engage in the use of technology to investigate the mathematical concepts of probability and graphing. They use the skills of predicting an outcome to come up with reasonable possibilities. Students also practice using a...
Curated OER
Calculating the Cost of a "Sound Basic Education"
Students state their opinions about school funding and the use of monetary resources by school districts and use reasons, facts, and examples to support their ideas. They compare sets of data related to school funding and draw...
Howard Hughes Medical Institute
Measuring Biodiversity in Gorongosa
Take your biology class' understanding of biodiversity to a whole new level! Ecology scholars use data to calculate three different diversity indices based on the organisms in the Gorongosa National Park. The four-part activity uses an...
Curated OER
Computation with Fractions
Upper graders are introduced to the topic of fractions and percentages. In groups, they discuss real world situations in which fractions are present, and they complete a worksheet solving problems with common and uncommon denominators....
Curated OER
Metric on the Move
Students are taught that the metric system is a decimal system of weights and measures based on the meter for length, the kilogram for weight, and the liter for volume. They research how to convert from imperial units of measure to the...
Curated OER
What Did It Cost 100 Years Ago?
Students compare prices of good across the century in order to introduce the topic of inflation. They undertand the concepts of inflation and Consumer Price Index (CPI), use online calculators to figure the approximate cost of goods...
Curated OER
Inflation
Students compare prices then and now. They use the calculated rate of inflation to figure out the equivalent prices today for items sold at the fair and money earned in 1864. They calculate the actual value of a bowl of soup, a dinner,...
Curated OER
I Am Golden
Middle schoolers become familiar with patterns, the Fibonacci Sequence, and the Golden Ratio. They see how many places these occur. They have practical applications for using the calculator and making charts to extend patterns.
Radford University
SAT and ACT – How Equitable Are They?
Test the test takers' knowledge of statistics about data from the SAT and ACT tests. Future collegians explore the idea of gender and racial bias in high-stakes college admissions exams. They analyze historical data on average scores by...


