Curated OER
Beginning Modeling for Linear and Quadratic Data
Young scholars create models to represent both linear and quadratic equations. For this algebra lesson, students collect data from the real world and analyze it. They graph and differentiate between the two types.
Curated OER
Real-World Linear Equations
Eighth graders practice technology skills through the use of a spreadsheet and a discovery lesson plan focusing upon linear equations. The technology allows for the visual changes to be displayed for different lines of equations.
Key Curriculum Press
Triangle Inequalities
Properties about triangles are explored in this activity. Geometers make conjectures about the length of a triangle's sides, the length of the angles in relation to the length of the sides, and the measure of the exterior angles of a...
Curated OER
Celsius to Fahrenheit
Students convert degrees between two different units. In this algebra instructional activity, students graph linear equations and identify the line of best fit. They use their line of best fit to make predictions given a set of data.
Curated OER
Jumping to Solutions
Learners explore two-step linear equations. In this middle school Pre-algebra lesson, students create and solve equations that describe how a person got to an end postion on a ruler by jumping. After physically creating the situation,...
Mathematics Vision Project
Module 5: Modeling with Geometry
Solids come in many shapes and sizes. Using geometry, scholars create two-dimensional cross-sections of various three-dimensional objects. They develop the lesson further by finding the volume of solids. The module then shifts to finding...
Curated OER
Linear Regression (and Best Fit)
High schoolers explore notions of relationships between two variables. They use discussion, games, worksheets, spreadsheets to consider relationships such as: height vs. shoe size, cricket chirping vs. temperature.
5280 Math
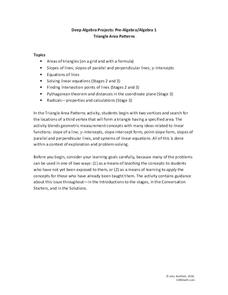
Triangle Area Patterns
Combine algebraic and geometric strategies to find solutions. The task asks learners to find the coordinates of a third vertex of a triangle to create a triangle with a specific area. The project is a set of seven problems that helps...
Bowland
Alien Invasion
Win the war of the worlds! Scholars solve a variety of problems related to an alien invasion. They determine where spaceships have landed on a coordinate map, devise a plan to avoid the aliens, observe the aliens, and break a code to...
Statistics Education Web
The United States of Obesity
Mississippi has both the highest obesity and poverty rate in the US. Does the rest of the data show a correlation between the poverty and obesity rate in a state? Learners tackle this question as they practice their skills of regression....
Curated OER
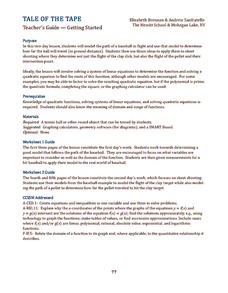
Tale of the Tape
How can baseball and skeet-shooting be modeled mathematically? Sports lovers and young mathematicians learn how to use quadratic equations and systems of equations to model the flight paths of various objects.
EngageNY
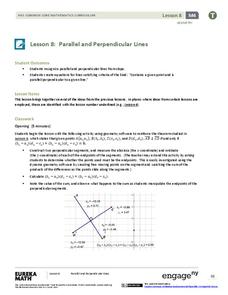
Parallel and Perpendicular Lines
Use what you know about parallel and perpendicular lines to write equations! Learners take an equation of a line and write an equation of a line that is parallel or perpendicular using slope criteria. They then solve problems to...
EngageNY
The Height and Co-Height Functions of a Ferris Wheel
Show learners the power of mathematics as they model real-life designs. Pupils graph a periodic function by comparing the degree of rotation to the height of a ferris wheel.
Statistics Education Web
Text Messaging is Time Consuming! What Gives?
The more you text, the less you study. Have classes test this hypothesis or another question related to text messages. Using real data, learners use technology to create a scatter plot and calculate a regression line. They create a dot...
Curated OER
Why Doesn't My New Shirt Fit?
Pupils test Leonardo da Vinci's view of the human body by measuring various body parts using a tape measure. They create a data table and a scatter plot and then analyze and interpret the results using a graphing calculator.
Curated OER
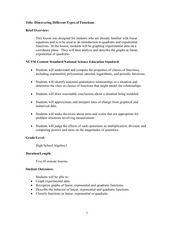
Discovering Different Types of Functions
Graph polynomials and identify the end behavior of each polynomial function. The class differentiates between linear, quadratic, and other polynomial equations.
Curated OER
Statistics with M&Ms
Seventh graders explore estimation, measurement, and probability. Students conduct surveys and create charts & graphs. They study the history of chocolate. Students design their own magazine advertisement or create a script for a...
Curated OER
It's a Drag!
Students create number lines using decimals and whole numbers. In this algebra lesson, students graph and solve linear equations. They plot ordered pairs on a coordinate plane correctly.
Curated OER
Automobile-Accident Reconstruction
Students investigate an accident and relate it to math. In this trigonometry instructional activity, students measure the accident scene, the friction produced, and the speed from the skid marks. They create a poster of their findings.
Curated OER
Introduction to Tangent Lines using the TI-Nspire
Learners make mathematical argument using the concept of Limit. In this algebra lesson, student calculate the instantaneous rate of change from the linear graph. They use a TI-calculator to create a visual of the graphs.
EngageNY
Two Graphing Stories
Can you graph your story? Keep your classes interested by challenging them to graph a scenario and interpret the meaning of an intersection. Be sure they paty attention to the detail of a graph, including intercepts, slope,...
Curated OER
Sliding Along
Third graders use a ruler that has a bag tie slider attached to it to measure a number of items. While measuring, they complete a "Sliding Along" worksheet and a "Sliding Synthesis Journal." In the journal entry, they include what they...
Curated OER
The Fractal Coast
Students investigate measuring as it relates to the real world. In this geometry lesson, students measure distances as they discuss fractals and how it relates to measuring. They measure both linear and non-linear distances.
Curated OER
The UPS Experiment
Pupils calculate the speed using metric measurements. In this geometry lesson, students calculate speed, distance and velocity using metric measurements. They gain inquiry and problem solving skills in this assignment.


