American Statistical Association
A Sweet Task
Candy is always an effective motivator! A fun math activity uses M&M's and Skittles to explore two-way frequency tables and conditional probability. The candy can serve a dual purpose as manipulatives and experimental data.
Education Development Center
Language of Algebra
Don't rush into algebra, let learners visualize, guess, and predict their way to a successful math career. The introductory unit incorporates beginner algebraic concepts with shapes instead of variables. Young mathematicians use a...
Project Maths
Introduction to Patterns
The world is full of patterns. Help learners quantify those patterns with mathematical representations. The first Algebra lesson in a compilation of four uses a series of activities to build the concept of patterns using multiple...
Mathematics Vision Project
Module 9: Modeling Data
How many different ways can you model data? Scholars learn several in the final module in a series of nine. Learners model data with dot plots, box plots, histograms, and scatter plots. They also analyze the data based on the data...
Curated OER
Creating a Thematic Map
Students create and analyze a weather-related data table and a thematic map based upon information provided.
Statistics Education Web
I Always Feel Like Somebody's Watching Me
Future statisticians and potential psychics first conduct an experiment to collect data on whether a person can tell if someone is staring at them. Statistical methods, such as hypothesis testing, chi-square tests, binomial tests, and...
101 Questions
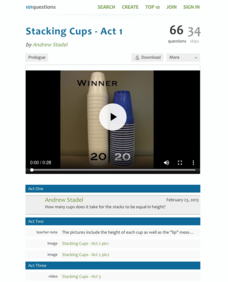
Stacking Cups
Facilitate an understanding of equality using a modeling task. After watching different-sized cups being stacked, learners use their math skills to determine when the height of each cup tower will be the same. Meant as an introduction to...
Curated OER
Now That's Using Your Head!
Explore linear measurement. Scholars will measure the circumference of their head and the distance they can jump. Information is recorded, averages are calculated, and a data table is completed. They then determine possible relationships...
Kenan Fellows
Man vs. Beast: Approximating Derivatives using Human and Animal Movement
What does dropping a ball look like as a graph? An engaging activity asks learners to record a video of dropping a ball and uploading the video to software for analysis. They compare the position of the ball to time and calculate the...
5280 Math
Factory Functions
Solve a real-life problem using function-building skills. Presented with an open-ended question, scholars complete a checklist to create and justify a solution in an interesting algebra project. The checklist asks for justifications of...
101 Questions
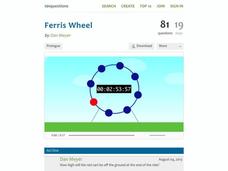
Ferris Wheel
Around and around you'll go! Learners analyze the periodic nature of a Ferris wheel. Using a trigonometric function, they make predictions about the location of a specific car at the end of the ride and its total trips around the circle.
EngageNY
Applying Tangents
What does geometry have to do with depression? It's an angle of course! Learners apply the tangent ratio to problem solving questions by finding missing lengths. Problems include angles of elevation and angles of depression. Pupils make...
Statistics Education Web
First Day Statistics Activity—Grouping Qualitative Data
Making groups of groups can help to organize data. Classes use statistics to group themselves using descriptive adjectives. The objective is for learners to understand that grouping qualitative data is useful when the original groups are...
Achieve
Ivy Smith Grows Up
Babies grow at an incredible rate! Demonstrate how to model growth using a linear function. Learners build the function from two data points, and then use the function to make predictions.
Education Development Center
Interpreting Statistical Measures—Class Scores
Explore the effect of outliers through an analysis of mean, median, and standard deviation. Your classes examine and compare these measures for two groups. They must make sense of a group that has a higher mean but lower median compared...
Virginia Department of Education
Attributes of a Rectangular Prism
A change is coming. Pupils use unit cubes to investigate how changes in the length, width, and/or height affects volume and surface area. They extend the results to write and test predictions on the effect of changing multiple sides on...
Balanced Assessment
Stick Patterns
Sticks and stones may break my bones, but these sticks will make me smarter. Pupils examine arrays of sticks to determine the next array in a pattern. They use the number of sticks added to each previous array to determine a recursive...
Curated OER
Flicking Football Fun
Young mathematicians fold and flick their way to a deeper understanding of statistics with a fun, hands-on math unit. Over the course of four lessons, students use paper footballs to generate data as they learn how to create line...
EngageNY
Interpreting the Graph of a Function
Groups sort through NASA data provided in a graphic to create a graph using uniform units and intervals. Individuals then make connections to the increasing, decreasing, and constant intervals of the graph and relate these connections...
EngageNY
Why Do Banks Pay YOU to Provide Their Services?
How does a bank make money? That is the question at the based of a lesson that explores the methods banks use to calculate interest. Groups compare the linear simple interest pattern with the exponential compound interest pattern.
EngageNY
Graphing the Tangent Function
Help learners discover the unique characteristics of the tangent function. Working in teams, pupils create tables of values for different intervals of the tangent function. Through teamwork, they discover the periodicity, frequency, and...
American Statistical Association
Don't Spill the Beans!
Become a bean counter. Pupils use a fun activity to design and execute an experiment to determine whether they can grab more beans with their dominant hand or non-dominant hand. They use the class data to create scatter plots and then...
Illustrative Mathematics
Are These Right?
Is that a right triangle or a wrong triangle? Young mathematicians look at eleven different shapes and use a measuring tool of their choice to determine which triangles have right angles. Consider cutting out sets of the shapes to...
Curated OER
Making Simple Conversions
Fourth graders explore unit conversions. They create visual models of measurement units, identify tables of equivalent units and make simple conversions with in a measurement system. Students produce charts that identify units of measure...


