Curated OER
Whose Line is it Anyway?
Students solve systems of equations. In this algebra lesson, students identify the domain and range of each function. They use the slope and y-intercept to graph each line.
Education Development Center
Points, Slopes, and Lines
Before graphing and finding distances, learners investigate the coordinate plane and look at patterns related to plotted points. Points are plotted and the goal is to look at the horizontal and vertical distances between coordinates and...
Curated OER
Border Patrol ID: 11603
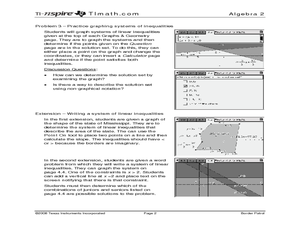
Incorporate technology in your classroom by teaching your students how to graph systems of linear inequalities as they apply to an area of land. The lesson provides an extension in which students are challenged to write a system of...
Curated OER
Getting Started with the TI-Navigator™ System: What's My Rule?
Young scholars explore linear relationships. In this sixth through eighth grade mathematics activity, students explore the symbolic representation of verbal descriptions of mathematical rules defining the relationship between two variables.
101 Questions
CoinStar
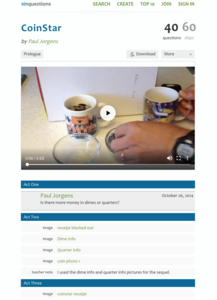
Would you rather have a bowl of dimes or a bowl of quarters? A video introduces the problem by presenting two bowls, one full of quarters and another full of dimes. Learners use information from a CoinStar receipt to calculate the number...
101 Questions
What Micheal’s Coupon Should You Use?
Get your classes on their way to extreme couponing! Young mathematicians analyze two different coupon options for the better deal. They use different scenarios to predict and compare the outcomes.
Teach Engineering
Doing the Math: Analysis of Forces in a Truss Bridge
Join together to investigate truss joints. Scholars learn how to analyze forces at truss joints to determine the strength of truss bridges. They apply the "method of joints" in calculating the tension and compression forces at each joint...
EngageNY
Complex Numbers and Transformations
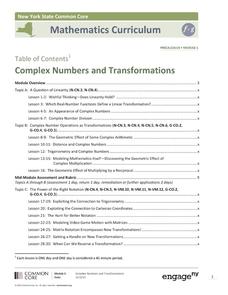
Your learners combine their knowledge of real and imaginary numbers and matrices in an activity containing thirty lessons, two assessments (mid-module and end module), and their corresponding rubrics. Centered on complex numbers and...
Curated OER
Lines, Rays, Line Segments, and Planes
Learners are introduced to lines, rays, line segments and planes. They explore the differences between lines, rays, line segments and planes. Students pracice graphing lines, rays, line segments and planes.
Curated OER
Functions and the Vertical Line Test
Students examine functions and function notation. They use computer activities to discover how to graph functions, and conduct a vertical line test. Students describe spatial relationships using coordinate geometry.
Curated OER
Spreadsheet Function Machine
Students create a spreadsheet to analyze functions. In this algebra lesson, students use spreadsheets to find the intersection of systems of equations. They identify the dependent and independent function as it relates to a line.
Alabama Learning Exchange
Bloodstain Pattern Doesn't Lie......
An interesting instructional activity on hypothesizing about the diameter of a drop of blood that is splattered. To test their theories, learners work in groups to make blood droplets splatter from different heights. They use graphed...
Curated OER
Stochastic and Deterministic Modeling
Explore the difference between stochastic and deterministic modeling through programming. First have the class write algorithms for relatively simple tasks using pseudocode. Use the Python 2.7 program app to simulate Mendel's Pea Pod...
101 Questions
The Biggest Loser
Sometimes losing is actually winning! Learners use a proportional analysis to compare percent weight loss of contestants on The Biggest Loser. The resource provides data and clips from the show to facilitate the lesson.
Curated OER
Count the Differences
Students determine the degree of polynomials. In this determining the degree of polynomials lesson, students find the difference between consecutive y-values. Students find the degree of a linear, quadratic, and cubic function by this...
Curated OER
The Kangaroo Conundrum: A Study of a Quadratic Function
Pupils play a game and collect data for their graph. For this algebra lesson, students solve quadratic equations and identify properties of their graph. They describe the pattern created by the graph and the game.
Curated OER
A Study of a Quadratic Function
Learners factor and solve quadratic equations. In this algebra lesson, students play a game as the collect and graph data. they identify properties of their parabola and make predictions.
5280 Math
Pythagorean Triples
From Pythagorean triples to the unit circle. Learners use the Pythagorean Theorem to find Pythagorean triples and then relate their work to the unit circle in a fun algebra project. Their discovery that x^2+y^2 is always equal to one on...
Curated OER
How Many Solutions 2
Young scholars solve systems of equations. In this algebra lesson, students graph lines and identify the point of intersection. They identify the function to see if it is a function.
Howard County Schools
Planning for Prom
Make the most of your prom—with math! Pupils write and use a quadratic model to determine the optimal price of prom tickets. After determining the costs associated with the event, learners use a graph to analyze the break even point(s).
Curated OER
Slope Fields
Students create and analyze slope fields. In this calculus lesson, students create a visual of differential equations. They use the Ti Navigator to create slope fields.
Curated OER
Maximizing Your Efforts
Young scholars graph systems of equation. In this algebra lesson, students find where the lines cross and identify the type of solution. They analyze a graph and write the equation of the line.
Curated OER
Rational Numbers
Young scholars investigate rational numbers in this algebra lesson. They graph systems of equations and use technology to find the point of intersection. They need a TI for this assignment.
Curated OER
Basic Matrix Algebra
Students perform basic matrices operations. In this algebra lesson, students add, subtract, multiply and divide matrices. They solve system of equations using matrices.
Other popular searches
- Systems of Linear Equations
- System of Linear Equations
- Systems Nonlinear Equations
- Linear Equations System


