Curated OER
What Can We Learn From the Past?
What would future archeologists learn from your scholars' personal belongings? Have them bring in a box of "primary sources" from their home. Discuss the difference between observations and inference, using some of your own items to...
Curated OER
Learning Inference
Making inferences can be a tricky proposition for middle schoolers. In the lesson presented here, pupils practice the skill of drawing a conclusion and making a judgment - which are what making an inference is all about! There are five...
Curated OER
Signs of Change: Tree Rings
Young scholars identify and experiment with dendrochronology (the study of tree rings to answer ecological questions about the recent past) and come up with conclusions as to what possible climatic conditions might affect tree growth in...
Curated OER
Analyzing Two or More Nonfiction Texts
How does recognizing the author's purpose help you draw conclusions about a topic? Using two articles (both are attached), learners brainstorm why each author wrote each article. Are their purposes similar or different? Learners use a...
Statistics Education Web
How High Can You Jump?
How high can your pupils jump? Learners design an experiment to answer this question. After collecting the data, they create box plots and scatter plots to analyze the data. To finish the lesson, they use the data to draw conclusions.
Statistics Education Web
Consuming Cola
Caffeine affects your heart rate — or does it? Learners study experimental design while conducting their own experiment. They collect heart rate data after drinking a caffeinated beverage, create a box plot, and draw conclusions....
Curated OER
Memories to Last: Observing Monuments
Students use scientific observation and inference to examine the Hazen Brigade Monument. In this observation lesson, students review the reasons for building monuments in society. Students then recall monuments they have seen and...
Howard Hughes Medical Institute
Reading Primary Sources: Darwin and Wallace
Take your classes back in time. Learners read real historical texts from both Darwin and Wallace as well as an announcement of their findings. Using guiding questions, they make inferences and draw conclusions from the information in the...
Curated OER
Application and Modeling of Standard Deviation
The first activity in this resource has learners computing the mean and standard deviation of two different data sets and drawing conclusions based on their results. The second activity has them using a dice-rolling simulation to...
Curated OER
Are We Alone
Seventh graders collect/analyze data and draw conclusions; support reasoning by using a variety of evidence; construct logical arguments; access information at remote sites using telecommunications; apply the concept of percent;...
Curated OER
Mysterious Footprints
Learners, after observing and responding to two pictures, consider the interaction of two unknown animals by examining the pattern of their footprints. They make observations, draw conclusions and propose possible explanations for the...
Curated OER
SUNSPOTS SPOTTED
Students study sunspots and their motion, from data gathered, they determine the significance of the sunspot data. The data be used to calculate the rotational period of the sun. They draw conclusions as to the sunspot's impact on the...
Curated OER
Making and Breaking the Grid
Students examine the grid in terms of a method of organization in our society as well as graphic design. In this "Making and Breaking the Grid" lesson, students design solutions to common problems and draw conclusions about patterns and...
Curated OER
How Oceans Affect Climate
Young scholars draw conclusions about how the ocean affects temperature. In this weather lesson plan, students use the Internet to gather data to help them come to a conclusion about how the climate in a certain region is directly...
Curated OER
Climate Change
Students compare weather data and draw conclusions. For this climate change lesson plan, students determine whether data collected over a period of ninety years shows a warming trend.
Curated OER
The Fat and the Lean
Students collect data on calorie intake. For this algebra lesson, students use the collection of data to make better eating decisions. They investigate the nutritional value in food using a graph and draw conclusion from their findings.
Curated OER
The Changing Nature of Work, Employment, and Education in Canada.
Students identify the effect caused by change of employment and education. In this statistics lesson, students analyze data and draw conclusions. This assignment tests students' ability to use data correctly.
Curated OER
What Is Viscosity?
Students experiment with the visocosity of corn syrup, mineral oil, vegetable oil, water, and honey. They research viscosity before beginning. Pupils draw the conclusion that the marble sinks more slowly in the liquids with greater...
American Statistical Association
Don't Spill the Beans!
Become a bean counter. Pupils use a fun activity to design and execute an experiment to determine whether they can grab more beans with their dominant hand or non-dominant hand. They use the class data to create scatter plots and then...
Shodor Education Foundation
Replacement and Probability
Middle and high schoolers explore the concept of probability. In this probability lesson, learners conduct an experiment with a bag of marbles. Pupils draw marbles from a bag and determine the probability of drawing a particular color...
Curated OER
Clay Boats
Seventh graders are given the opportunity to use model-building as a way to help comprehend the forces and phenomena at work in the world around them. They use both successful and unsuccessful models to make inferences, refine...
Curated OER
Fish Communities in the Hudson
Students use tables of fish collection data to draw conclusions about where fish live in the Hudson Estuary. Given available data they interpret organized observations and measurements and recognize simple patterns, sequences, and...
Curated OER
Venn Diagram and UK Basketball
Students analyze data and make inferences. In this algebra lesson, students collect and analyze data as they apply it to the real world.
Curated OER
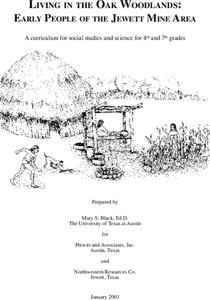
Living in the Oak Woodlands: Early People of the Jewett Mine Area
Students examine the archeology and native peoples of the Jewett Mine area of Texas. Using a map, they explain the economic patterns of the native groups and how the geography of the area affected activities. They compare and contrast...

