Balanced Assessment
Cost of Living
Math scholars investigate the cost of living in Hong Kong compared to Chicago but must first convert the different types of currency. They then choose a type of graph to compare different spending categories and finish the activity by...
NASA
Food For Thought
Science can be quite tasty. A delectable unit from NASA shows learners why it's important to consider food, nutrition, and health in space. Four lessons explore the idea in great depth, including testing cookie recipes. Along the way,...
Curated OER
Graphing Linear Equations Using the Table Method
Students graph linear equations using a table. In this algebra lesson, students create a table of values using the linear equation to find the y-values. They plot their point on a coordinate plane and graph the line.
Curated OER
Investigation-Mathematical Reasoning: Tables and Chairs
Fourth graders design a table and chair arrangement. For this mathematical reasoning lesson, 4th graders place tables shaped like equilateral triangles so that they seat the appropriate number of guests.
Curated OER
Cool Tools to Solve Challenging Word Problems
Students explore math functions by completing worksheets in class. For this word problem lesson, students read the story A Remainder of One and practice solving division problems from the story. Students complete a worksheet which...
Curated OER
Function Tables
Students identify function using tables of data. In this algebra instructional activity, students create a tale of point and plot on a coordinate plane. They analyze the graph as being a function or not.
Curated OER
Introduction to Functions
Students explore functions, function rules, and data tables. They explore terms of linear functions. Students use computers to analyze the functions. Students write short sentences to explain data tables and simple algebraic expressions.
Curated OER
Elements of Life
Students discover they are made of elements in activities based on comparing the human body to the periodic table. In this science lesson students are engaged with 3 hands on basic chemistry activities. The students end the lesson by...
Curated OER
Writing Equations from a Table
Students graph and evaluate equations. In this algebra activity, students are given pairs of coordinates and asked to write an equation representing the values. They are also given values to plug in to their equations and evaluate.
Virginia Department of Education
Growing Patterns and Sequences
Learners explore, discover, compare, and contrast arithmetic and geometric sequences in this collaborative, hands-on activity. They build and analyze growing patterns to distinguish which kind of sequence is represented by a set of data...
Cornell University
Math Is Malleable?
Learn about polymers while playing with shrinky dinks. Young scholars create a shrinky dink design, bake it, and then record the area, volume, and thickness over time. They model the data using a graph and highlight the key features of...
EngageNY
Examples of Functions from Geometry
Connect functions to geometry. In the ninth installment of a 12-part module, young mathematicians create functions by investigating situations in geometry. They look at both area and volume of figures to complete a well-rounded lesson.
Virginia Department of Education
Exponential Modeling
Investigate exponential growth and decay. A set of six activities has pupils collecting and researching data in a variety of situations involving exponential relationships. They model these situations with exponential functions and solve...
Curated OER
Multi-dimensional Modeling of Ore Bodies Making Sense of Empirical Data
Math scholars identify four different rock types in that strata and use this identification and data to construct a two dimensional geologic cross-section. They use data tables to construct a three-dimensional geologic cross-section.
Curated OER
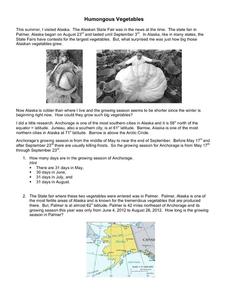
Humongous Vegetables
Humongous vegetables can inspire and awaken your mathematicians to the large math concepts in our Common Core standards. What is the secret to growing such gargantuan garden objects in Alaska? In the state that is closest to the North...
Illustrative Mathematics
Voting for Three, Variation 2
Here is another opportunity for math students to apply reasoning to solve real-world problems with ratios. The ratio of the number of votes for two candidates is provided. Your class is asked to use this ratio and information given about...
101 Questions
How Many Hot Dogs?
Top off your hot dogs with a little math. Learners view a video on a hot dog eating contest, and then answer questions using estimation. Using a table of hypothetical data, they create algebraic expressions to represent the situation.
Curated OER
Comparing Investments
Money, money, money. A complete activity that makes use of different representations of simple and compound interest, including written scenarios, tables, graphs, and equations to highlight similarities and differences between linear and...
Illustrative Mathematics
Ratio of Boys to Girls
How many boys are in the class? Here is an introductory exercise describing ratios. The commentary shows different ways learners can approach the problem, using a tape diagram of boys to girls and using a table. The activity includes...
SHS Algebra
Linear vs. Exponential Functions Tasks
Your algebra learners will enjoy the real-life application of the three tasks presented here. They complete a table and a graph comparing the two options presented. One option is linear, while the other is exponential. After coming up...
Radford University
Data Analysis Activity
What do classmates think? In groups, learners design surveys to investigate chosen topics. They conduct the survey, then analyze the results. As part of the activity, they must calculate the mean, median, mode, variance, and standard...
Curated OER
Eat Your Veggies
Students investigate displaying data. In this displaying data lesson, students use tallies to count data about food preferences. Students use various types of graphs such as bar graphs, picture graphs, box-and-whisker plots, etc to...
Curated OER
Dealing with Data
Seventh graders collect and analyze data. In the seventh grade data analysis lesson, 7th graders explore and/or create frequency tables, multiple bar graphs, circle graphs, pictographs, histograms, line plots, stem and leaf plots, and...
PwC Financial Literacy
Saving and Investing: Investing for the Future
A fine lesson on saving and investing is here for you and your middle schoolers. In it, learners explore the values of time and money, and discover how small amounts of money invested over time can grow into a large "pot of gold." They...
Other popular searches
- Math Tables and Tools
- +Math Tables Tips Tools
- Input Output Table Math
- Math Table. Elementary Math
- Math Tables Tips Tools
- Math Tables and Graphs
- Making Math Tables
- Input/output Tables Math
- Math Table Elementary Math
- Learning Math Tables
- Math Tables Multiplacation
- Making a Math Table


