Mathematics Assessment Project
Generalizing Patterns: Table Tiles
As part of a study of geometric patterns, scholars complete an assessment task determining the number of tiles needed to cover a tabletop. They then evaluate provided sample responses to see different ways to solve the same problems.
Education Development Center
Creating a Polynomial Function to Fit a Table
Discover relationships between linear and nonlinear functions. Initially, a set of data seems linear, but upon further exploration, pupils realize the data can model an infinite number of functions. Scholars use multiple representations...
Alabama Learning Exchange
Building Functions: Inverse Functions from Tables and Graphs
Is the inverse a function? Scholars learn how to examine a function to answer this question. Using an online interactive, they examine the properties of inverse functions to compare to the original function.
California Mathematics Project
For the Birds
It turns out math IS for the birds! Here, learners use mathematical reasoning to determine how often someone needs to fill a bird feeder. The rate the feeder empties varies by the number of holes that are available to the birds. Day two...
EngageNY
Association Between Categorical Variables
Investigate associations between variables with two-way tables. Scholars continue their study of two-way tables and categorical variables in the 15th installment of a 21-part module. The lesson challenges them to calculate relative...
EngageNY
Modeling Linear Relationships
Math modeling is made easy with the first installment of a 16-part module that teaches pupils to model real-world situations as linear relationships. They create graphs, tables of values, and equations given verbal descriptions.
CK-12 Foundation
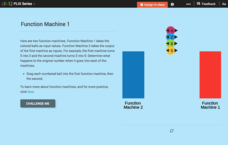
Function Rules for Input-Output Tables: Function Machine 1
Challenge your classes to find the pattern of a double function machine. After recording the outputs of both machines, learners identify the pattern and the corresponding function. Both patterns involve adding/subtracting a constant.
CK-12 Foundation
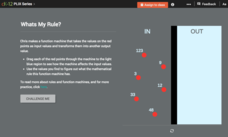
Function Rules for Input-Output Tables: Whats My Rule?
What's the rule that makes it true? A virtual function machine generates output values as learners submit the input values. Their job is to analyze the inputs and outputs for a pattern and write a function rule.
CK-12 Foundation
Function Rules for Input-Output Tables: Function Machine!
Watch as a function machine converts an input to an output. Learners determine the work applied by the function machine to write a function rule. Questions accompany the function machine animation to guide individuals to conclusions.
CK-12 Foundation
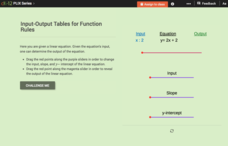
Input-Output Tables for Function Rules
Make the abstract a bit more concrete with an interactive that asks learners to slide an input value through a function to determine the output. Changing the slope and y-intercept allows them to see the how the output values change.
Teach Engineering
Discovering Relationships Between Side Length and Area
Consider the relationship between side length and area as an input-output function. Scholars create input-output tables for the area of squares to determine an equation in the first installment of a three-part unit. Ditto for the area of...
Curated OER
Frequency Tables and Stem-and-Leaf Plots
Students are introduced to the function of frequency tables and stem and leaf plots. In groups, they determine the frequency of their teacher coughing, ringing a bell or raising their hand. To end the lesson, they determine frequency...
Curated OER
Data Displays with Excel
Students collect and analyze data. In this statistics lesson, students display their data using excel. They plot the data on a coordinate plane and draw conclusion from their data.
Curated OER
Fun with Math using Magnetic Force
Sixth graders explore and discuss the effectiveness of magnets in different situations. For this math lesson, 6th graders discuss rate and graphs after exploring with magnets using different restrictions on the magnets. They analyze...
Curated OER
Applied Science - Science and Math Lab
Although it was written to use in a science class, this measurement lesson is adaptable to Common Core standards in math for measurement and data. Youngsters are introduced to two types of measurement systems. They use both the English...
Curated OER
Carnival Tickets
A great subtraction and division discovery opportunity for young mathematicians, this learning task involves seven word problems that require multiple steps. Learners use a math table to persevere in solving problems that are supported...
Curated OER
Proportionality in Tables, Graphs, and Equations
Students create different methods to analyze their data. In this algebra lesson, students differentiate between proportion and non-proportional graph. They use the TI-Navigator to create the graphs and move them around to make their...
Utah Education Network (UEN)
Finding Slope of a Line from Graphs, Tables, and Ordered Pairs
Middle schoolers explore the concept of slope in numerous ways and start to look at simple linear equations. They describe the slope in a variety of ways such as the steepness of a line, developing a ratio, using graphs, using similar...
Illustrative Mathematics
Price per Pound and Pounds per Dollar
Help learners understand the concept of unit rate as it is applied to buying beans at a grocery store. The objective is to determine the unit rate in two ways, and then apply each ratio to an additional problem. The attached commentary...
Curated OER
Comparing Costs
Students compare the costs of two cellular phone plans and determine the best rate. They use a table and a graph of points plotted on a Cartesian plane to display their findings. Students write an equation containing variables that could...
American Statistical Association
A Sweet Task
Candy is always an effective motivator! A fun math activity uses M&M's and Skittles to explore two-way frequency tables and conditional probability. The candy can serve a dual purpose as manipulatives and experimental data.
02 x 02 Worksheets
Inverse Variation
Discover an inverse variation pattern. A simple lesson plan design allows learners to explore a nonlinear pattern. Scholars analyze a distance, speed, and time relationship through tables and graphs. Eventually, they write an equation to...
Mathematics Vision Project
Module 9: Modeling Data
How many different ways can you model data? Scholars learn several in the final module in a series of nine. Learners model data with dot plots, box plots, histograms, and scatter plots. They also analyze the data based on the data...
Project Maths
Introduction to Patterns
The world is full of patterns. Help learners quantify those patterns with mathematical representations. The first Algebra lesson in a compilation of four uses a series of activities to build the concept of patterns using multiple...
Other popular searches
- Math Tables and Tools
- +Math Tables Tips Tools
- Input Output Table Math
- Math Table. Elementary Math
- Math Tables Tips Tools
- Math Tables and Graphs
- Making Math Tables
- Input/output Tables Math
- Math Table Elementary Math
- Learning Math Tables
- Math Tables Multiplacation
- Making a Math Table


