Curated OER
Conditions at Sea Data Activity
Students study how to forecast sea conditions. In this oceanography lesson students complete a class activity on wave making.
Curated OER
Veggie Chop and Data Analysis
First graders chop vegetables into fractions. In this fractions lesson, 1st graders cut vegetables, collect data about favorite vegetables and create a bar graph using the information. Students make inferences about the data and record...
Curated OER
Twelve Days of Christmas--Prediction, Estimation, Addition, Table and Chart
Scholars explore graphing. They will listen to and sing "The Twelve Days of Christmas" and estimate how many gifts were mentioned in the song. Then complete a data chart representing each gift given in the song. They also construct...
Curated OER
State Names: Frequency
Data grathers determine the frequency of specified data. They identify the frequency that specified letters occur in the names of all 50 states. They create stem-and-leaf plots, box-and-whisket plots and historgrams to illustrate the data.
Intel
What Does This Graph Tell You?
What can math say about natural phenomena? The fifth STEM lesson in this project-based learning series asks collaborative groups to choose a phenomenon of interest and design an experiment to simulate the phenomenon. After collecting...
NASA
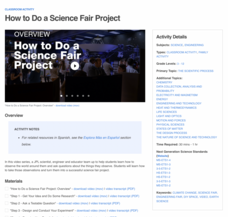
How to Do a Science Fair Project
Build problem-solving skills with science! Step-by-step videos walk investigators through each stage of completing a science fair project. Scientists learn to formulate a testable question, design an experiment, collect data, draw...
Curated OER
What Color Are Your Skittles?
Students create spreadsheets and manipulate data. They collect data, create appropriate graphs and use percentages to describe quantities. Students compare and contrast data. They use spreadsheets to generate a pie chart.
Curated OER
Pike Problems in Lake Davis
Pike fish pose a threat to native trout and catfish in lakes. Would you drain and poison a lake to get rid of the Pike fish? If the lake was drained and poisoned, then refilled and repopulated with trout and catfish, how would you...
Beyond Benign
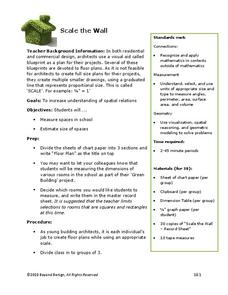
Scale the Wall
How can you fit an entire school on one sheet of paper? You use scale! Scholars measure rooms in the school and, using the correct scale, design a floor plan that includes area calculations with their data.
Curated OER
Survival of the Fittest – Battling Beetles
Students explore natural selection. For this genetic adaptation lesson, students discover why certain traits continue and some traits disappear. Students discover how species evolve and change. Resources are provided.
Curated OER
Rainforest (Elementary, Social Studies)
Explore the rainforest with your class. Learners study the meaning of the word endangered, choose an animal to study, gather data, and discuss why the animal is in danger of extinction. This is a motivating way to have your class discuss...
Curated OER
Cyberspace Safari
Middle schoolers go on an information gathering hunt on the Internet to study West African empires. They work in teams; meteorologists, bankers, writers, and archaeologists. They collect data on all sorts of topics related to West...
University of Minnesota
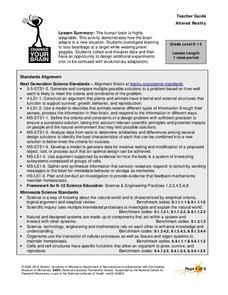
Altered Reality
Fascinate young life scientists by showing them how their brain learns. By using prism goggles while attempting to toss bean bags at a target, lab partners change their outlook on the world around them, producing amusing results....
Curated OER
Sound Walk: Discovering Data and Applying Range, Mode, and Mean
Elementary schoolers sharpen their listening skills as they use sound maps, tallies, and line plots to organize and interpret data. Everyone takes a "sound walk," and focuses on the sounds around them. They chart and tabulate the sounds...
Curated OER
Our Desert Backyard
Students make observations of their own backyard. In this environment lesson, students keep records of the plants and animals they see in their home or school yard. Students make notes of how the weather and environment changes over...
Curated OER
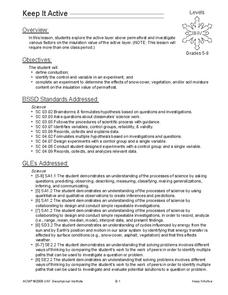
Keep it Active
Learners explore the active layer above permafrost and investigate various factors on the insulation value of the active layer. In this energy transfer instructional activity, students conduct and experiment to determine the effects of...
Curated OER
What Does the Sun Give Us?
Pupils study the sun and how solar energy works. To learn about renewable energy, they complete a lab activity using a pizza box as a solar heater. Quite clever!
Curated OER
Growing a Lawn
Students research plant growth. In this plant growth lesson, students explore the needs of plants. Students compare and contrast grass and broadleaf plants and grow a miniature lawn in a cup of soil. Resources are provided.
Curated OER
Analyzing Discrete and Continuous Data in a Spreadsheet
You are what you eat! Your statisticians keep a log of what they eat from anywhere between a day to more than a week, keeping track of a variety of nutritional information using a spreadsheet. After analyzing their own data, individuals...
Curated OER
Aluminum Adventure
Chemistry aces use an electrochemical cell to anodize a strip of aluminum. They apply an organic dye to it. In a practical application, they design a piece of jewelry out of the anodized metal and describe the process. Thorough notes...
Curated OER
A Research Project and Article For the Natural Inquirer
Get your class to use the scientific process to solve a scientific problem. They utilize the Natural Inquirer magazine to identify a research question which they write an introduction to and collect data to answer. They use graphs,...
Curated OER
2nd Grade - Act. 17: Source Relay
Help your 2nd graders understand the difference between natural and man-made materials. They will sort breakfast food items into sources: store, factory, natural world, and farm. They will work together to classify, form conclusions, and...
Curated OER
Cardiac Hill
Learners calculate pulse rates to determine level of exertion. In this human body lesson, students hike up a hill or steep slope and take their pulse. Learners observe their breathing and energy level then record data.
Curated OER
Bias in Statistics
Students work to develop surveys and collect data. They display the data using circle graphs, histograms, box and whisker plots, and scatter plots. Students use multimedia tools to develop a visual presentation to display their data.


