Curated OER
TV Weather Announcers
Elementary schoolers collect and record weather data for their local area using data from newspapers, Web sites, and television reports. The read and record data daily, and groups prepare a presentation on their findings for the entire...
Curated OER
"Lucky Charms": Interpreting Data and Making Predictions
Seventh graders determine if a "lucky charm" will increase their chances of winning a game. Students calculate the experimental probability of each player in a game. They observe and collect data from each activity. Students compare the...
Curated OER
Analyzing Discrete and Continuous Data in a Spreadsheet
You are what you eat! Your statisticians keep a log of what they eat from anywhere between a day to more than a week, keeping track of a variety of nutritional information using a spreadsheet. After analyzing their own data, individuals...
Intel
Forensics: Get a Clue
Although the methods are all scientific, forensic science was started by police officers rather than scientists, who relied on observation and common sense. Young detectives use many tools to solve crimes around the school in a...
Curated OER
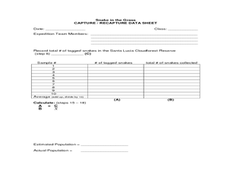
Snake in the Grass: Capture/Recapture Activity
Learners estimate the total number of species in Ecuador using the capture/recapture method. They collect data about each species and act as members of a science expedition to determine the total number of species by using mathematical...
Curated OER
The Power of Graphical Display: How to Use Graphs to Justify a Position, Prove a Point, or Mislead the Viewer
Analyze different types of graphs with learners. They conduct a survey and determine the mean, median and mode. They then identify different techniques for collecting data.
Curated OER
Cover Up: Tools for Integrating Math and Engineering
Blend art, adolescent snacking habits, and math to create new cereal boxes. Secondary learners review scale drawings. They use this information to construct cereal boxes to scale and will compare their creation to the original product to...
Curated OER
Interpreting Medical Data
Students explore human anatomy by graphing scientific data. In this vision lesson plan, students discuss how ophthalmology works and take their own eye assessment test using the Snellen chart. Students collect vision data from all of...
Curated OER
Beach Cleanup at a Local Beach
Students participate in an environmental clean-up activity. In this environmental lesson, students travel to a local beach. Working in small teams, students collect trash from the local beach. Returning to school, students sort the trash...
Curated OER
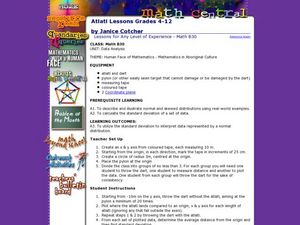
Atlatl Lessons Grades 4-12: Lesson for Beginning Users of Atlatl
Sixth graders determine the mean, range median and mode of a set of numbers and display them. In this data lesson plan students form a set of data and use computer spreadsheet to display the information. They extend of the process by...
Curated OER
What Color Are Your Skittles?
Students create spreadsheets and manipulate data. They collect data, create appropriate graphs and use percentages to describe quantities. Students compare and contrast data. They use spreadsheets to generate a pie chart.
Curated OER
Pizza, Pizza
Students survey community members to determine their favorite pizza toppings and create a bar graph to show their findings. In this probability and statistics instructional activity, students collect data by conducting a survey. They...
Curated OER
Human Face of Mathematics - Mathematics in Aboriginal Culture
Students collect statistical data. In groups, students play a dart game and then determine the distance between darts. They collect the data and plot the information on a coordinate plane. They identify the mean and the standard...
Curated OER
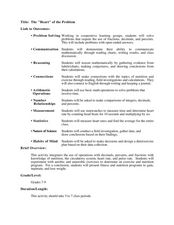
The "Heart" of the Problem
Young scholars explore mathematical operations while studying nutrition. In this physical fitness lesson plan, students explore calories, pulse rate, and the circulatory system. Young scholars use mathematical data to create a healthy...
Curated OER
How Do You Like Your Eggs?
First graders conduct a poll about how people like their eggs. In this graphing instructional activity, 1st graders collect data about how they like their eggs. Students use a picture of themselves to place under the type of egg they...
Curated OER
M & M Madness
Students work with the mathematics unit of collection, organization, and presentation of data. In this math and technology lesson plan, students use Valentine M & M’s and The Graph Club to sort and graph the various colored M & M’s.
Curated OER
Designing a Germination Experiment
Students explore botany by participating in a seed experiment. In this plant nutrition instructional activity, students define several science experiment vocabulary terms like observation, treatment, and replicate. Students utilize...
Curated OER
Creek Detectives WISE On-line Research Community
Learners investigate ways people cause harm to the environment. In this environmental lesson, students explore a case study on the Internet. Learners explore all of the online activities and collect data for a presentation.
Curated OER
Hands on Habitat
Students teach others about habitats. In this Science lesson, students use a Science Log to record data about a habitat for research. Students analyze the data and construct an eco-chamber. Students share what they have found with other...
Curated OER
Our Favourite Halloween Treat
Students conduct a survey about Halloween candy and create a bar graph illustrating the data. In this data analysis lesson, stud nets are introduced to the topic with a discussion and survey, then the class creates a large graph and...
PBL Pathways
Medical Insurance 2
Make an informed decision when choosing a medical insurance provider. An engaging lesson asks your classes to write piecewise models to represent the cost of different medical plans. The project-based learning activity is a variation of...
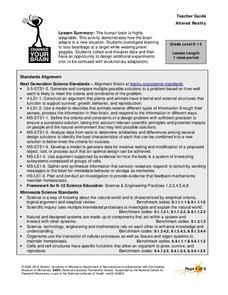
University of Minnesota
Altered Reality
Fascinate young life scientists by showing them how their brain learns. By using prism goggles while attempting to toss bean bags at a target, lab partners change their outlook on the world around them, producing amusing results....
Intel
What Does This Graph Tell You?
What can math say about natural phenomena? The fifth STEM lesson in this project-based learning series asks collaborative groups to choose a phenomenon of interest and design an experiment to simulate the phenomenon. After collecting...
Intel
Play Ball!
Math and sports meet on the baseball diamond in the first STEM lesson in a series of six that asks pupils to collect and perform comparative analyses of data specific to baseball. Following the analysis, scholars create a presentation...


