Henrico County Public Schools
Models for Teaching Addition and Subtraction of Integers
Positive and negative numbers are everywhere in the world around us. Whether it's charged particles in atoms, a hot air balloon rising and falling in the sky, or a series of bills and checks being delivered in the mail, this resource...
Visa
Keeping Score: Why Credit Matters
How does one get credit, and who provides credit? What is a credit score, and how can an understanding of a credit score help you to make smart financial decisions? Through discussion and worksheets, class members will identify the...
Practical Money Skills
Student Loans
If your learners are college bound, they'll need a lesson about student loans and personal finance before they step into their dorm room. A four-day lesson guides high schoolers through the process of budgeting for college, as well as...
Practical Money Skills
Living on Your Own
Every teen dreams of living independently, but often without thinking about the details and costs involved with moving out. Three lessons in a unit about living on your own focus on moving costs, fixed and flexible costs associated with...
EngageNY
Interpreting the Graph of a Function
Groups sort through NASA data provided in a graphic to create a graph using uniform units and intervals. Individuals then make connections to the increasing, decreasing, and constant intervals of the graph and relate these connections...
Curriculum Corner
Guest Teacher Plans Grade 4
Creating substitute plans may not be the highlight of your workday. Make the task less daunting with a general, day-long plan covering math, reading, word work, and writing.
Mathed Up!
Pie Charts
Representing data is as easy as pie. Class members construct pie charts given a frequency table. Individuals then determine the size of the angles needed for each sector and interpret the size of sectors within the context of frequency....
EngageNY
Conducting a Simulation to Estimate the Probability of an Event II
Add some randomization into simulations. The 11th installment in a series of 25 presents two new methods to use in simulations--colored disks, and random numbers. Pupils use random numbers to run simulations where the probabilities make...
EngageNY
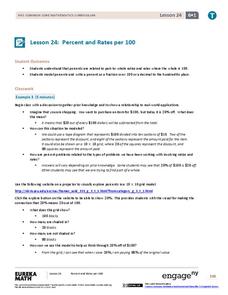
Percent and Rates per 100
What percentage of your class understands percents? Pupils learn the meaning of percents based upon rates per 100 in the 24th instructional activity in a series of 29. They represent percents as fractions, decimals, ratios, and models....
EngageNY
Comparison Shopping—Unit Price and Related Measurement Conversions II
Which rate is greater and by how much? Pupils continue to compare rates to solve problems in the 20th portion of a 29-part series. Rates are presented in a variety of representations either using the same representation or different...
EngageNY
Conducting a Simulation to Estimate the Probability of an Event
How can you complete a simulation when it is not practical to determine the probability of an event? Class members learn that in some situations, it is not feasible to find the probability of an event, but they can estimate it by running...
EngageNY
Creating a Histogram
Display data over a larger interval. The fourth segment in a 22-part unit introduces histograms and plotting data within intervals to the class. Pupils create frequency tables with predefined intervals to build histograms. They describe...
Curated OER
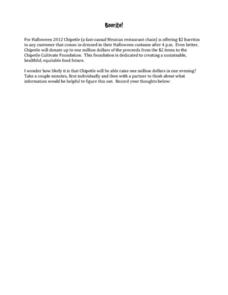
Boorito!
Delicious Chipotle burritos are a big treat, especially when they are offered for only $2.00. This Halloween-themed learning experience isn't tricky, but learners will need to think critically about division with large numbers in order...
Illustrative Mathematics
How Much is a Penny Worth?
Are pennies really worth one cent? Here, learners use rates to calculate the price per pound of copper that would result in pennies that are exactly one cent's worth of copper. Might work best as a group or whole-class activity since the...
The Digits
Telling Time: The Digits
Time to teach your students how to read a clock? This resource is here to help! Engaging young mathematicians with two fun videos and a series of hands-on activities, these lessons offer a multimedia approach to teaching this important...
Curated OER
The Stock Market: High School Economics
High school economists learn about the stock market in a project where they "buy" and track stocks. The author of this resource reports it is the high point of her 12th grade economics course, but no resources are attached. After viewing...


