EngageNY
Interpreting Residuals from a Line
What does an animal's gestation period have to do with its longevity? Use residuals to determine the prediction errors based upon a least-square regression line. This second lesson on residuals shows how to use residuals to create a...
Teach Engineering
Alloy the Way to Mars
Future engineers test different alloys to determine the specific strength of each one. Based on the results, they make a recommendation to NASA on which alloy to use on engines for spacecraft.
EngageNY
Interpreting the Graph of a Function
Groups sort through NASA data provided in a graphic to create a graph using uniform units and intervals. Individuals then make connections to the increasing, decreasing, and constant intervals of the graph and relate these connections...
Wild BC
The Greenhouse Effect: Warming the Earth Experiment
First in a two-part instructional activity on the greenhouse effect, this instructional activity involves a classroom demonstration of the phenomenon, and a lab group experiment with color and absorption. Although there are easier ways...
Pingry School
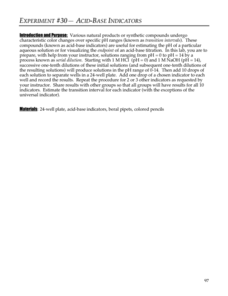
Acid-Base Indicators
Acid-base indicators are an essential part of any chemistry classroom. Individuals explore the color-changing feature of the important indicators in a vibrant hands-on activity. Using serial dilution, learners create solutions ranging...
EngageNY
Exponential Decay
I just bought that car, how can its value decrease already? Individuals use the data of a depreciating car value to create an exponential decay model. They then compare exponential decay and growth equations.
EngageNY
The Difference Between Theoretical Probabilities and Estimated Probabilities
Flip a coin to determine whether the probability of heads is one-half. Pupils use simulated data to find the experimental probability of flipping a coin. Participants compare the long run relative frequency with the known theoretical...
Virginia Department of Education
Attributes of a Rectangular Prism
A change is coming. Pupils use unit cubes to investigate how changes in the length, width, and/or height affects volume and surface area. They extend the results to write and test predictions on the effect of changing multiple sides on...
Purdue University
Designing a Device Utilizing a Balloon Filled with Carbon Dioxide
Don't waste all that carbon dioxide. Scholars first produce carbon dioxide by mixing baking soda and vinegar. They measure the masses of the reactants and products to verify the law of conservation of mass. As a culminating activity,...
Towson University
Mystery Disease
How did scientists determine the cause of illness before technology? Science scholars play the role of medical researcher in an engaging guided inquiry activity. Using observations, technical reading, and Punnett squares, learners...
Curated OER
Basketball Bounces, Assessment Variation 1
This highly scaffolded, summative assessment tasks learners to choose the model that represents the height of a bouncing basketball given the data in graph and table form. Learners then use the model to answer questions about the...
Curated OER
Basketball Bounces, Assessment Variation 2
This un-scaffold summative assessment tasks learners to use the height of a bouncing basketball, given the data in graph and table form, to choose the model that is represented. Learners then use the model to answer questions about the...
EngageNY
Conditional Relative Frequencies and Association
It is all relative, or is it all conditional? Using an exploration method, the class determines whether there is an association between gender and superpower wish through the use of calculating conditional relative frequencies. The last...
Curated OER
Sandia Aerial Tram
Your learners analyze a table of real-life data in order to write an equation that best models the information. Exponential, quadratic, and linear rates of changes are all possibilities in this task.
Florida Department of Health
Nutrition: Developing Healthy Habits Unit
The focus of the fourth unit in the Youth Risk Behavior Survey Curriculum is on healthy eating and exercise. Class members examine healthy habits data from the YRBD Youth Online Tool, learn about the importance of a healthy diet and...
Kid Zone
Groundhog's Day Graphing
This Groundhog's Day, challenge scholars to predict, estimate, tally, and graph in a weather-themed lesson in which class members play the role of the groundhog to forecast the weather come February second.
Institute of Electrical and Electronics Engineers
Playing with Parachutes
This lesson plan certainly will not be a drag! Little engineers design parachutes that make use of air resistance and, as a result, slow the descent of the payload as much as possible. It is an opportunity to teach about many motion...
Curated OER
Hand Span and Height
Is there a relationship between hand span width and height? Statisticians survey each other by taking measurements of both. A table that can hold data for 24 individuals is printed onto the worksheet, along with questions for analysis....
Annenberg Foundation
Skeeters Are Overrunning the World
Skeeters are used to model linear and exponential population growth in a wonderfully organized lesson plan including teachers' and students' notes, an assignment, graphs, tables, and equations. Filled with constant deep-reaching...
Mathematics Vision Project
Module 8: Probability
It's probably a good idea to use the unit. Young mathematicians learn about conditional probability using Venn diagrams, tree diagrams, and two-way tables. They also take into consideration independence and the addition rules.
University of Colorado
Looking Inside Planets
Researchers use scientific data to understand what is inside each of the planets. The first in a series of six, this lesson builds off of that concept by having pupils use a data table to create their own scale models of the interiors of...
Ohio Department of Education
Observe Then Infer
To develop their skill at drawing inferences from observations, sixth graders rotate through six stations, conduct a series of experiments, make observations, and draw inference from what they observe.
Center for Learning in Action
Introduction to the States of Matter
Liquids, gases, and solids are the states of matter in which scholars investigate in a lesson plan that offers in-depth information and engaging activities that look into the three states and the changes their properties make when mixed...
Pingry School
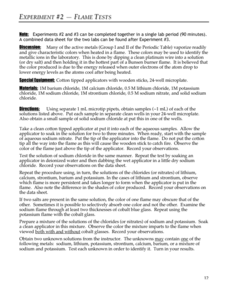
Flame Tests
Light a fire in your pupils! Scholars conduct a flame test and observe the emission spectra of several different salts in an enlightening hands-on investigation. They use their observations to make comparisons and conclusions about the...


