Shodor Education Foundation
Stem and Leaf Plotter
The key is in the leaves. Pupils enter data to create a stem-and-leaf plot. The resource then displays the plot and calculates the mean, median, and mode of the data. Using the plot and the calculated measures of spread, learners analyze...
Curated OER
Button Bonanza
Collections of data represented in stem and leaf plots are organized by young statisticians as they embark some math engaging activities.
Workforce Solutions
30 Seconds
Thirty seconds are all scholars have to develop an engaging commercial to showcase their talents and experience within a specific occupation. Pairs work collaboratively to keep each other on time to deliver information speedily and ask...
Radford University
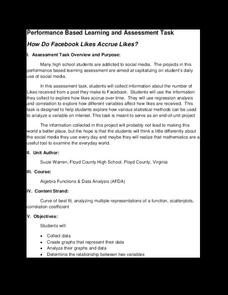
How Do Facebook Likes Accrue Likes?
Finally, a project pupils will instantly like! Young mathematicians collect data on the number of likes they receive for a social media post over time. During the first part of the project, they determine a curve of best fit and...
Curated OER
Ornithology and Real World Science
Double click that mouse because you just found an amazing instructional activity! This cross-curricular Ornithology instructional activity incorporates literature, writing, reading informational text, data collection, scientific inquiry,...
Museum of Tolerance
Why is This True?
Are wages based on race? On gender? Class members research wages for workers according to race and gender, create graphs and charts of their data, and compute differences by percentages. They then share their findings with adults and...


