Physics Classroom
Action-Reaction Lab
Computer-interfaced motion detectors are required to carry out this inquiry. It is a new twist on exploring motion with plunger carts: they are set back-to-back and then propelled away from each other. Their velocities are measured, and...
Creative Learning Exchange
The Infection Game: The Shape of Change
Encourage the spread of knowledge in your class with this cross-curricular epidemic simulation. Pulling together science, social studies, and math, this instructional activity engages students in modeling the spread of infectious...
Curated OER
Solar Kit Lesson #11 - Power Maximum: An Electrical Determination
Collaborative groups connect resistors and solar panels in series and measure electrical resistance, voltage, and current. The objective is to order 16 solar panels from strongest to weakest. They graph current-voltage and power curves...
Curated OER
Adaptations to Niches and Habitats
Life science learners measure and record traits of seeds, leaves, and their own hands and then graph the data to find a continous distribution curve. They compare and color diagrams of seven different animals' forelimbs (not included),...
Curated OER
Come On Down!
Begin with an introduction to famous deep-sea submersibles. Learners work in groups to gather information on different vessels and then share with the class. Each group then uses water displacement to help calculate the density of...
NOAA
Wet Maps
How do oceanographers make maps under water? Junior explorers discover the technologies and processes involved in creating bathymetric maps in part three of a five-part series designed for fifth- and sixth-grade pupils. The instructional...
Shodor Education Foundation
Scatter Plot
What is the relationship between two variables? Groups work together to gather data on arm spans and height. Using the interactive, learners plot the bivariate data, labeling the axes and the graph. The resource allows scholars to create...
Center for Learning in Action
Investigating Physical and Chemical Changes
Super scientists visit ten stations to predict, observe, and draw conclusions about the physical and chemical changes that occur when different states of matter—liquid, solid, and gas—are placed under a variety of conditions. To...
Teach Engineering
Water Remediation Lab
Water filtration — that's pure genius! Groups test the ability of a water filter to purify water by running chlorine contaminated water through a filter and measuring the chlorine concentrations as they filter the water. They then graph...
National Wildlife Federation
Summer Midnight Sun
Sunlight hours and climate have a clear connection. Young researchers collect data about the sunrise and sunset times in an Arctic climate as well as the average temperatures. They then graph their data to make connections between the...
Population Connection
The Peopling of Our Planet
How many people live on the planet, anyway? The first resource in a six-part series covers the topic of the world population. Scholars work in groups to conduct research and make population posters after learning about the global...
Virginia Department of Education
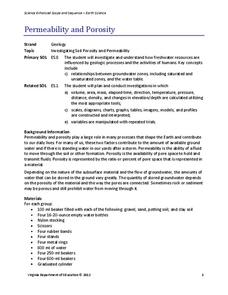
Permeability and Porosity
Covering both permeability and porosity, scholars perform a hands-on experiment testing various soil types. The material includes a pre-lesson plan worksheet to help focus pupils on the task at hand.
Teach Engineering
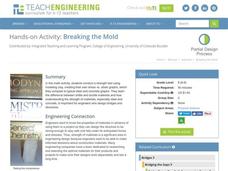
Breaking the Mold
A little too much strain could cause a lot of stress. Groups conduct a strength test on clay. Using books as weights, pupils measure the compression of clay columns and calculate the associated strain and stress. Teams record their data...
Shodor Education Foundation
Box Plot
What information can come from a box? Learners choose a data set to display as a box plot and decide whether to include the median in the calculation of the quartiles, show the outliers, and change the scale. To finish the lesson,...
Teach Engineering
Concentrating on the Sun with PVs
Concentrate to determine the best reflector design. Pairs use the engineering design process to build a reflector to increase the current output of a photovotaic panel. Teams arrive at a final design and present it to the class along...
Science 4 Inquiry
The Yin and Yang of Photosynthesis: Day vs. Night
Floating fragments of elodea can grow even without roots. Young scientists use eldoea plants to observe the oxygen production from photosynthesis. They study the difference between having access to high amounts of light and low amounts...
Teach Engineering
How Effective is Your Sunscreen?
Protect skin from UV radiation! Groups design and conduct an experiment to test the effectiveness of UV safety products. The groups collect the data from the experiment and prepare a lab report. In the second day of the activity,...
Missouri Department of Elementary
Are You Balanced?
Balance scales create a strong visual of how an individual prioritizes one's self alongside their commitments to the community, school, and home. Scholars complete a graphic organizer then discuss their findings with their peers. A...
Curated OER
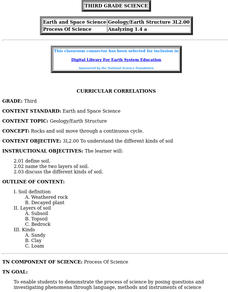
Curricular Correlations
An interesting lesson on different types of soils is here for you. In it, learners discuss what soil is, and consider three piles of soil - clay, sand, and loam. During the rest of the lesson, third graders discover all sorts of...
Curated OER
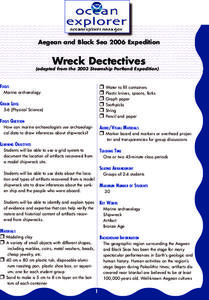
Wreck Detectives
Junior archaeologists examine types of artifacts from the Bronze Age on the internet. In collaborative groups, they create a story about a ship from this period and then construct a model of the ocean floor after their ship has sunk....
Manitoba Education and Early Childhood Learning
A Foundation for Implementation
Color is the focus of this amazing resource packed with math, social studies, science, and language arts activities. Kids create a color word wall and post symbols, graph the number of objects they find of each color while on a treasure...
Natinal Math + Science Initative
Slope Investigation
Context is the key to understanding slope. A real-world application of slope uses a weight loss scenario with a constant rate of change to introduce the concept of slope of a line, before it makes a connection to the ordered pairs and...
National Academy of Sciences
Lights at Night Webquest
Help learners find ways to become more efficient energy consumers. To start, individuals research how different countries address energy efficiency and then analyze their own carbon footprint. They use their research to identify ways to...
Shodor Education Foundation
Skew Distribution
Slide the class into a skewed view. Learners alter the location of the median relative to the mean of a normal curve to create a skew distribution. They compare the curve to a histogram distribution with the same skewness.


