Illustrative Mathematics
Sand Under the Swing Set
Help the local elementary school fix their playground by calculating the amount of sand needed near the swing set. The problem practices setting up proportions and ratios with three different options for solving. You can chose the option...
Curated OER
Algebra 1: Slope as Rate
Learners solve problems with slopes. In this algebra lesson, students identify the slope of a line and relate it to the rate of change. They graph their lines on the TI and observe changes in the lines.
Illustrative Mathematics
Comparing Speeds in Graphs and Equations
Compare two different proportional relationships on a graph. It is up to your mathematicians to determine which of two moving objects have greater speed. A good example of a Common Core multiple choice question.
Charleston School District
Review Unit 3: Functions
Time to show what you know about functions! The review concludes a series of nine lessons on the basics of functions. The problems included are modeled from the previous lessons. Pupils determine if a table represents a function,...
Achieve
Yogurt Packaging
Food companies understand how to use math to their advantage. Learners explore the math related to the packaging and serving size of yogurt. They then use unit analysis and percent values to make decisions on the product development.
EngageNY
The Slope of a Non-Vertical Line
This lesson introduces the idea of slope and defines it as a numerical measurement of the steepness of a line. Pupils then use the definition to compare lines, find positive and negative slopes, and notice their definition holds for...
EngageNY
The Computation of the Slope of a Non-Vertical Line
Determine the slope when the unit rate is difficult to see. The 17th part of a 33-part series presents a situation that calls for a method to calculate the slope for any two points. It provides examples when the slope is hard to...
Illustrative Mathematics
Velocity vs. Distance
At the end of this activity, your number crunchers will have a better understanding as to how to describe graphs of velocity versus time and distance versus time. It is easy for learners to misinterpret graphs of velocity, so have them...
Illustrative Mathematics
Molly's Run
A simple lesson with a lot of support behind it. Your learners will find out how long it takes Molly to run a mile by choosing their solution method. The activity can be used as a lesson or as an independent assignment. Preface with...
Balanced Assessment
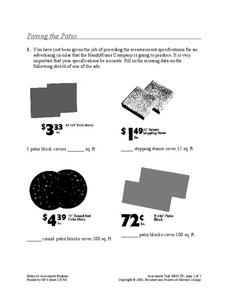
Paving the Patio
Next time you need to repave your patio, have your scholars do all the math. They first calculate and answer questions using the area of patio blocks. Next, they determine the cheapest block to use to pave the patio.
101 Questions
Speed of Light
How quickly does light travel long distances? A short video simulates light going from the earth to the moon at two different paces. Scholars relate the distance to the rate to understand which simulation is correct.
101 Questions
Bean Counting
Don't spill the beans ... before the end of the lesson! Learners must predict how long it takes two people working together to fill a glass with beans. A video presents the rate it takes each person independently, and another video...
Curated OER
Ratio, Rates and Percentages
In this ratio, rates and percentages worksheet, 8th graders solve 22 various types of problems related to ratios, rates and percentages. They first write ratios in lowest terms and describe each of comparison stated. Students also solve...
CCSS Math Activities
Smarter Balanced Sample Items: 8th Grade Math – Target C
Target C from the Smarter Balanced assessment for eighth grade is understanding the connections between proportional relationships, lines, and linear equations. A slide show includes items about graphing proportional relationships and...
Illustrative Mathematics
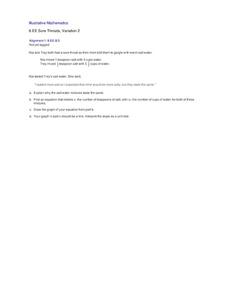
Sore Throats, Variation 2
What does math have to do with a sore throat? When you mix water and salt you have a great review of how to represent proportional relationships by an equation or graph. Here the proportions of the mixtures may be different, but the...
Curated OER
Ratios, Rates, Percent and Nutrition
Examine food labels to determine percentage of fat and sugar to total calories with middle schoolers. Daily nutritional guidelines are discussed and learners will decide how well their foods fit into a healthy diet. In the provided...
Illustrative Mathematics
Find the Change
This exercise is an opportunity for algebra learners to understand the connection between the slope of a line and points found on the line. Use similar triangles to explain why slope m is the same between any two points. Discuss with the...
Illustrative Mathematics
Buying Bananas, Assessment Version
Practice with unit rates, proportions, and ratios when Carlos purchases an amount of bananas. Learners must interpret a graph to decide whether points on the same line represent similar proportional relationships. Use with lesson plans...
Charleston School District
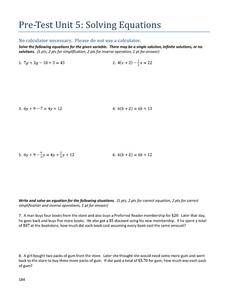
Pre-Test Unit 5: Solving Equations
Your pupils just may know more than you think they do! A pre-test assesses their ability to solve and write equations. It includes simple quadratic and cubic equations as well.
Bowland
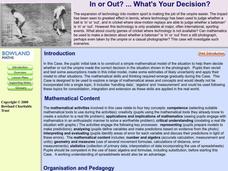
In or Out? ... What's Your Decision?
Young mathematicians use photos and video clips to determine if a cricket player is "in" or "out." This analysis occurs using scale factors, distance-rate-time formula, and consideration of precision and accuracy.
Mathalicious
Been Caught Stealing
You're safe, when calculating the odds of stealing second base! Learners compare the rate of a runner to the distance the ball travels, in a lesson that explores right triangles and measurement. Full of discussion questions and fun...
PwC Financial Literacy
Buying a Home: Terms of a Mortgage
Buying a home, dealing with a lender, securing a mortgage; these are daunting tasks for many adults. Why not teach middle schoolers about this area of adulthood so they are better-prepared to make the leap into home ownership when they...
Mathematics Assessment Project
Interpreting Distance–Time Graphs
Pre-algebra protégés critique a graph depicting Tom's trip to the bus stop. They work together to match descriptive cards to distance-time graph cards and data table cards, all of which are provided for you so you can make copies for...
Curated OER
A Day at the Beach
Help learners determine the rate of change for the temperature of sand. They will collect data on the temperature of wet and dry sand over time with a heat lamp overhead. Then make a scatter plot of the data and find a linear model to...


