Curated OER
Caley Table for the Symmetries of a Square
Middle and high schoolers complete Caley's table to indicate rotating a square 90, 180, and 270 degrees. They also reflect a square across the vertical and horizontal line. This one-page learning exercise contains eight movements.
CK-12 Foundation
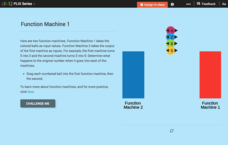
Function Rules for Input-Output Tables: Function Machine 1
Challenge your classes to find the pattern of a double function machine. After recording the outputs of both machines, learners identify the pattern and the corresponding function. Both patterns involve adding/subtracting a constant.
CK-12 Foundation
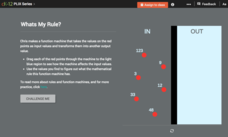
Function Rules for Input-Output Tables: Whats My Rule?
What's the rule that makes it true? A virtual function machine generates output values as learners submit the input values. Their job is to analyze the inputs and outputs for a pattern and write a function rule.
CK-12 Foundation
Function Rules for Input-Output Tables: Function Machine!
Watch as a function machine converts an input to an output. Learners determine the work applied by the function machine to write a function rule. Questions accompany the function machine animation to guide individuals to conclusions.
CK-12 Foundation
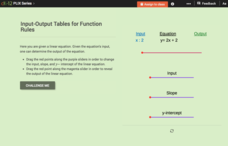
Input-Output Tables for Function Rules
Make the abstract a bit more concrete with an interactive that asks learners to slide an input value through a function to determine the output. Changing the slope and y-intercept allows them to see the how the output values change.
CK-12 Foundation
Conversion of Decimals, Fractions, and Percents
Five questions—true or false and multiple-choice—challenge mathematicians to convert decimals, fractions, and percents. An interactive table displays how to write a portion of shapes in a variety of ways. A discussion question concludes...
Curated OER
Ratio Tables
In this ratio table worksheet, students complete ten ratio tables. Students identify three equivalent fractions to equal the value of the given one. This one-page worksheet contains ten problems.
Curated OER
Data Analysis: Graphs, Charts, Tables, Statistics
In this data analysis worksheet, students interpret data in 5 problems involving graphs, tables, and scatterplots. Students construct 1 stem and leaf plot and find the mean, median, and mode of a data set.
Curated OER
Tables and xy-Coordinates
Use this graphing functions worksheet to have learners complete four tables and graph the results on the included coordinate grid.
Curated OER
Review Graphing Parabolas & Circles
Students review how to graph parabolas. They practice graphing two different parabolas using the vertex and table method. They solve problems related to graphing circles, determining the radius and the center.
Willow Tree
Linear Relationships
There's just something special about lines in algebra. Introduce your classes to linear equations by analyzing the linear relationship. Young mathematicians use input/output pairs to determine the slope and the slope-intercept formula to...
Curated OER
Function Tables
Students identify function using tables of data. In this algebra lesson, students create a tale of point and plot on a coordinate plane. They analyze the graph as being a function or not.
Curated OER
Patterns in Tables
In this patterns in tables practice learning exercise, students sharpen their problem solving skills as they solve 6 story problems that require them to write functions.
Curated OER
Probability
In this probability worksheet, 8th graders solve and complete 15 different problems related to determining the probability of various events. First, they complete the table illustrated on the sheet. Then, students use the table to...
Curated OER
Introduction to Functions
Students explore functions, function rules, and data tables. They explore terms of linear functions. Students use computers to analyze the functions. Students write short sentences to explain data tables and simple algebraic expressions.
Curated OER
Modeling in Algebra
In this modeling in algebra activity, 8th graders solve ten different types of algebra problems, including 5 word problems. They first complete each table, describe the pattern used, and determine the 20th and nth term for each. Students...
Curated OER
What Did It Cost 100 Years Ago?
Students compare prices of good across the century in order to introduce the topic of inflation. They undertand the concepts of inflation and Consumer Price Index (CPI), use online calculators to figure the approximate cost of goods...
Curated OER
Line Graphs
In this line graphs worksheet, 8th graders solve and complete 20 different problems that include reading various line graphs. First, they use the information provided in each line graph to determine the correct response to each of the...
Curated OER
Graphing Linear Functions
In this linear functions worksheet, learners graph 3 linear functions. Students graph each function by making a table of values given a linear function in standard form.
Curated OER
Graphing Linear Functions Two
Use this graphing linear functions worksheet to have learners graph three linear equations. They use a table of values, the intercept method, and slope-intercept form to graph three functions.
EngageNY
Association Between Categorical Variables
Investigate associations between variables with two-way tables. Scholars continue their study of two-way tables and categorical variables in the 15th installment of a 21-part module. The lesson challenges them to calculate relative...
Charleston School District
Review Unit 3: Functions
Time to show what you know about functions! The review concludes a series of nine lessons on the basics of functions. The problems included are modeled from the previous lessons. Pupils determine if a table represents a function,...
Charleston School District
Pre-Test Unit 3: Functions
How does an input affect an output? Assess your learners' ability to answer this question using this pre-test. Scholars answer questions about the basics of a function. Topics include determining if a table or statement represents a...
Mathed Up!
Frequency Polygons
Frequency polygons are a different way to represent frequencies over intervals. Pupils take frequencies for intervals of data from a frequency table and plot them as a frequency polygon. Budding mathematicians find information about the...
Other popular searches
- Multiplication Tables
- Math Tables and Tools
- Function Tables
- Input/output Tables
- Multiplication Tables 1 100
- Frequency Tables
- Input Output Tables
- +Math Tables Tips Tools
- Data Tables
- Tables, Charts and Graphs
- Multiplication Tables Songs
- Frequency Tables Line Plots


