Curated OER
Pythagorean Theorem
Eighth graders draw right triangles and identify the parts of a right triangle: right angle, interior and exterior angles, hypotenuse and legs. They predict and identify any relationships that exist between the sides of a right...
Curated OER
Earthquake Patterns
Learners identify and interpret the cyclical nature of the Parkfield, California earthquakes. They then investigate and graph earthquake occurrences on the Mojave segment of the San Andreas fault and then on the Hayward fault in order to...
Curated OER
Making the Connections
Use a Horton Chart to identify relationships between numbers and make equivalent fractions and decimals. Scholars change a fraction to find the greatest common factor, find percents, and make equivalent decimals.
Illinois State Board of Education
Is It Linear?
Math apprentices are introduced to the components of a linear relationship. In groups, they write story problems that incorporate this relationship and relates to the real world. They give their problem to the class for them to solve.
Curated OER
When Will We Ever Use This? Predicting Using Graphs
Here are a set of graphing lessons that have a real-world business focus. Math skills include creating a scatter plot or line graph, fitting a line to a scatter plot, and making predictions. These lessons are aimed at an algebra 1 level...
Illustrative Mathematics
Distance across the channel
Here you will find a model of a linear relationship between two quantities, the water depth of a channel and the distance across the channel at water level. The cross section of the channel is the shape of an isosceles trapezoid. The...
Illustrative Mathematics
Introduction to Linear Functions
Introduce your algebra learners to linear and quadratic functions. Learners compare the differences and relate them back to the equations and graphs. Lead your class to discussions on the properties of a function or a constant slope...
Illustrative Mathematics
Modeling with a Linear Function
Here is a well-designed resource that provides five yes-or-no questions which model different situations with linear functions. It makes a good pre-test for the beginning of the unit. The purpose is to elicit common misconceptions of...
Bowland
AstroZoo
Rescue animals in the zoo by applying math concepts. Groups of learners solve three missions involving oxygen, food, and climate control. Each group selects an animal from one of four bio-domes.
EngageNY
Linear and Nonlinear Expressions in x
Linear or not linear — that is the question. The lesson plan has class members translate descriptions into algebraic expressions. They take the written expressions and determine whether they are linear or nonlinear based upon the...
Shodor Education Foundation
Scatter Plot
What is the relationship between two variables? Groups work together to gather data on arm spans and height. Using the interactive, learners plot the bivariate data, labeling the axes and the graph. The resource allows scholars to create...
101 Questions
Mowing the Lawn
It'll take as long as it'll take. After watching a short video clip of someone moving a lawn as well as a running stopwatch, pupils estimate how long it would take to mow the entire lawn. Provided diagrams show the dimensions of the lawn...
101 Questions
Boat in the River
Ever feel like you're headed up the down escalator? Don't let your pupils get stuck in that rut! Practice writing equations to solve a problem using an engaging lesson. A video presents information that allows learners to determine how...
Mathed Up!
Straight Line Graphs
Develop graphs by following the pattern. The resource provides opportunities for reviewing graphing linear equations. Pupils create tables to graph linear equations by using patterns whenever possible. The worksheet and video are part of...
Curated OER
Go the Distance
Students work together to build lego cars. They make predictions about how fast they believe the cars will go. They record their observations and discuss their results.
Curated OER
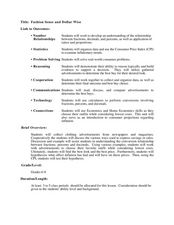
Fashion Sense and Dollar Wise
Students work in groups to show understanding of the relationship between fractions, decimals, percentages, and the application of ratios and proportions. In this decimals, fractions, and percents lesson, students use real life consumer...
Curated OER
Percents: What's the Use
Young scholars research percentages in real world situations. In this percents lesson, students demonstrate their ability to apply percents to everyday situations. Young scholars communicate mathematically by conducting interviews about...
Curated OER
Leonardo da Vinci
Students select appropriate tools and technology to perform tests, collect data, and display data. They construct appropriate graphs from data and develop qualitative statements about the relationships between variables.
Curated OER
comparison of Two Gender Sports Teams
Students gather data on sports team and create a box and whisper plot. In this data collection lesson, students find the median, the quartile range, and relationships between variables.
Curated OER
Cantilevers
Students perform an experiment to find the linear relationship between the appllied weight and the bend of the cantilever. In this linear relationships lesson, students follow detailed directions to set up an experiment. They add weights...
Curated OER
Mathematical Relationships
Students practice graphing a linear equation and a parabolic equation. They work cooperatively to select numbers, including fractions, which they will put into ordered pairs. Students explain their process to the class, discussing what...
Curated OER
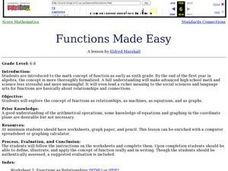
Functions Made Easy
Students explore concept of functions as relationships, as machines, as equations, and as graphs.
Curated OER
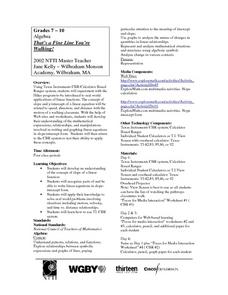
That's a Fine Line You're Walking!
Young scholars experiment with Hiker program to practice real world applications of linear functions and develop their understanding of expressions, relationships, and manipulations involved in writing and graphing linear equations in...
Curated OER
Hybrid Vehicles: Cut Pollution and Save Money
Students examine how driving a hybrid car can save money and cut down on pollution. In this hybrid vehicles lesson students complete an exercise that shows them how to work with proportions, percents, dimensional analysis and linear...
Other popular searches
- Healthy Relationships
- Interpersonal Relationships
- Linear Relationships
- Quadratic Relationships
- Ecological Relationships
- Family Relationships
- Symbiotic Relationships
- Angle Relationships
- Family Health Relationships
- Economic Relationships
- Cause and Effect Relationships
- Relationships Among Organisms


