Corbett Maths
Instantaneous Rates of Change
Here's a great lesson that looks at slope as an instantaneous change. Using an estimated tangent line, the presenter shows the class how to find an approximation for the instantaneous rate of change. Scholars determine the slope of the...
EngageNY
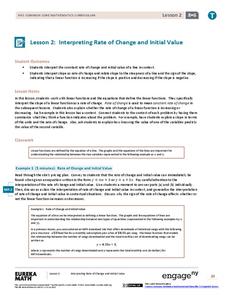
Interpreting Rate of Change and Initial Value
Building on knowledge from the previous instructional activity, the second instructional activity in this unit teaches scholars to identify and interpret rate of change and initial value of a linear function in context. They investigate...
EngageNY
Graphs of Linear Functions and Rate of Change
Discover an important property of linear functions. Learners use the slope formula to calculate the rates of change of linear functions. They find that linear functions have constant rates of change and use this property to determine if...
Corbett Maths
Average Rate of Change
Simply find the slope to find the average rate of change. A short video provides the definition of the average rate of change. Using the definition, pupils calculate the average rate of change to solve problems that cover finding average...
West Contra Costa Unified School District
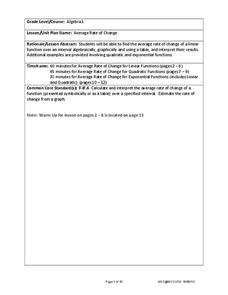
Average Rate of Change
Learners investigate average rates of change for linear functions and connect the concept to slope. They then determine average rates of change in quadratic and exponential functions.
Curated OER
Building Understanding of Rate of Change/Slopes Using Alice
Learners explore slope as a rate of change. In this eighth grade mathematics lesson, students investigate real-world problems to determine rate of change and transform it into a linear representation, thus determining slope. Learners...
EngageNY
Average Rate of Change
Learners consider the rate of filling a cone in the 23rd installment of this instructional activity series. They analyze the volume of the cone at various heights and discover the rate of filling is not constant. The instructional...
EngageNY
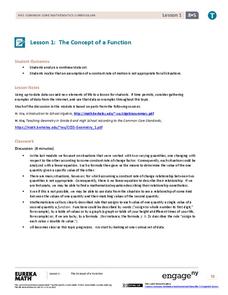
The Concept of a Function
Explore functions with non-constant rates of change. The first installment of a 12-part module teaches young mathematicians about the concept of a function. They investigate instances where functions do not have a constant rate of change.
Curated OER
Working with Rates of Change
In this calculus worksheet, students problem solve 8 word problems involving rates of change in association with high school students. Students work out each problem and give a short explanation of each answer.
Curated OER
A Day at the Beach
Help learners determine the rate of change for the temperature of sand. They will collect data on the temperature of wet and dry sand over time with a heat lamp overhead. Then make a scatter plot of the data and find a linear model to...
Illustrative Mathematics
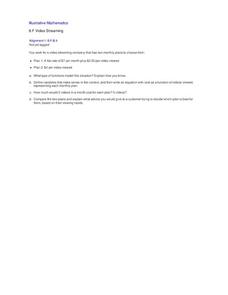
Video Streaming
Your movie fans will be interested in this resource. They will compare video streaming plans. One plan charges a set rate per month and a reduced viewing fee, and the other has a flat rate per each video viewed. Unfortunately, students...
Illustrative Mathematics
Battery Charging
Your class will be very interested in the results of this activity. How long does it take a MP3 and video game player to charge? Sam only has an hour and the MP3 player only has 40% of its battery life left. Plus, his video player is...
Curated OER
The Numbers Behind Hunger: Rate of Change
Explore the concept of world hunger by having students collect and graph 1990 world hunger statistics. They will analyze the data in order to determine how to decrease world hunger rates and try to determine problems and solutions of...
CCSS Math Activities
Smarter Balanced Sample Items: 8th Grade Math – Claim 2
Math can be a problem in eighth grade. Sample items show how problem solving exists within the eighth grade standards. Part of the Gr. 8 Claim 2 - 4 Item Slide Shows series, the presentation contains eight items to illustrate the...
Virginia Department of Education
Linear Modeling
An inquiry-based algebra lesson explores real-world applications of linear functions. Scholars investigate four different situations that can be modeled by linear functions, identifying the rate of change, as well as the strength and...
Noyce Foundation
First Rate
Explore distance and time factors to build an understanding of rates. A comprehensive set of problems target learners of all grade levels. The initial problem provides distance and time values and asks for the winner of a race. Another...
Concord Consortium
Be Well
How much do you spend on healthcare each year? Data shows the expenditures in the US rise significantly each year. Young scholars use the data to calculate a rate of change over a 30-year period and look for—as well as provide— possible...
CK-12 Foundation
Comparison of Unit Rates: Drive Away
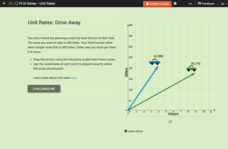
Five questions make up an interactive that challenges mathematicians to compare unit rates. Word problems question scholars about two friends going on a road trip. Scholars manipulate two cars on a coordinate plane to help solve word...
CCSS Math Activities
Smarter Balanced Sample Items: 8th Grade Math – Target F
Functions model relationships between quantities. The Smarter Balanced sample items demonstrate the assessment strategies for eighth grade function modeling standards. Items range from constructing linear functions from a table and a...
Curated OER
A Sweet Drink
Young scholars investigate reaction rates. In this seventh or eighth grade mathematics instructional activity, students collect, record, and analyze data regarding how the temperature of water affects the dissolving time of a sugar...
Curated OER
Mathemafish Population
It's shark week! In this problem, young mathematically minded marine biologists need to study the fish population by analyzing data over time. The emphasis is on understanding the average rate of change of the population and drawing...
Natinal Math + Science Initative
Slope Investigation
Context is the key to understanding slope. A real-world application of slope uses a weight loss scenario with a constant rate of change to introduce the concept of slope of a line, before it makes a connection to the ordered pairs and...
Curated OER
Algebra 1: Slope as Rate
Young scholars solve problems with slopes. In this algebra lesson, students identify the slope of a line and relate it to the rate of change. They graph their lines on the TI and observe changes in the lines.
EngageNY
Graphs of Simple Nonlinear Functions
Time to move on to nonlinear functions. Scholars create input/output tables and use these to graph simple nonlinear functions. They calculate rates of change to distinguish between linear and nonlinear functions.


