PBS
Working with Coordinate Planes: Activities and Supplemental Materials
Seven activities make up a collection of supplemental materials to reinforce graphing on a coordinate plane. Worksheet objectives include plotting coordinates within single and four quadrants, measuring straight and diagonal lines, and...
Jordan-Granite Consortium
Scatter Diagram
You aced the first test, so your score on the second one shouldn't matter, right? Young pupils first draw a best fit line on a provided scatter plot showing test scores for two different tests. They then evaluate five statements on the...
Mathematics Assessment Project
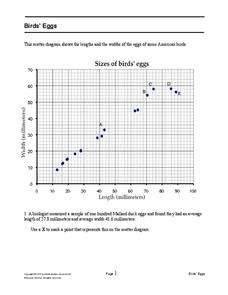
Bird’s Eggs
Are the length and width of birds' eggs related? Young ornathologists use a scatter plot to investigate the relationship between the length and width of eggs for Mallard ducks. They then determine the egg with the greatest...
Curated OER
Constellation Mapping
Students plot constellations on a grid map. They discuss the various ways early explorers planned their travels. Students identify and recognize major constellations. They color their maps and take them home to try to find various...
Curated OER
Mapping a Site Using a Coordinate Plane
Learners map their playground as if it were an archeological site. They locate objects on the playground and determine their location using coordinate points. A related instructional activity is Coordinate Grid: Mapping an Archeological...
Inside Mathematics
Scatter Diagram
It is positive that how one performs on the first test relates to their performance on the second test. The three-question assessment has class members read and analyze a scatter plot of test scores. They must determine whether...
Curated OER
Identify and Graph Linear Equations
Students investigate linear functions. In this mathematics lesson, students plot points onto a graph by solving the equations y=x and y=mx+b by being given numbers for x and solving for y.
Curated OER
Goldilocks and the Coordinate Grids
Where this lesson idea is lacking in materials, it makes up for with creativity! Using "Goldilocks and the Three Bears" as the background, mathematicians plot points on a coordinate grid to create props for the story. The polygons all...
Curated OER
LAND USE ISSUES
Students relate math with real life situations. They identify and plot points on a grid map. They identify and locate the Drop Box Sites.
Curated OER
Distance Formula
Students watch teacher demonstration of distance formula, view non-collinear cities on maps, plot points on coordinate plane, evaluate square roots, compute distance between two points, and use Heron's formula to find area of triangles.
Curated OER
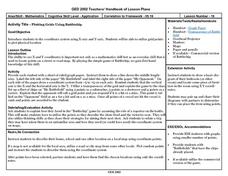
Plotting Grids Using Battleship
Young scholars coordinate grid points on X and Y axises to plot a physical location. The game of "Battleship is used to present first hand knowledge of this skill.
Mathematics Assessment Project
Sugar Prices
Sugar rush! In this assessment task, learners interpret points on a scatter plot representing price versus weight for bags of sugar. They then determine the bag that represents the best value.
Curated OER
Estimating the Mean State Area
Seventh grade statisticians randomly select five states and then determine the mean area. The class then works together to create a dot plot of their results.
University of Wisconsin
What’s a Square Foot Anyway? Laying Out the Design Plan
Clever! Participants don square-foot cardboard shoes to mark out the rain garden plot that they have spent the last few weeks designing. In this way, they are practicing scale modeling as well! Note that this lesson is part of a unit,...
Curated OER
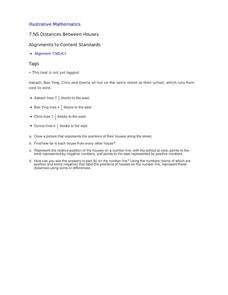
Distances Between Houses
This resource sneaks in the math so your learners will be adding and subtracting positive and negatives on a number line while thinking they are mapping out houses. The activity starts by putting houses the appropriate distance away from...
Curated OER
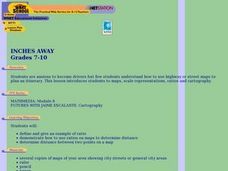
Inches Away
Learners are introduced to maps, scale representations, ratios and cartography. They plot the itinerary for their family's dream vacation or a trip across the United States. Using maps, they determine the short route and second longer...
Curated OER
Cross Section and Slope
Students draw cross sections of given contour maps. In this math lesson, students interpret the different symbols used in the map. They determine slope and steepness through direct measurement.
Curated OER
Concept: Points on a Grid
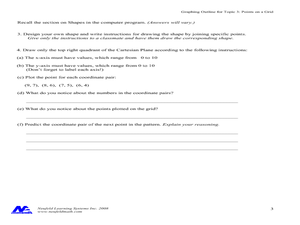
In this coordinate grid graphing worksheet, students play a game of Battleship on the computer. They answer 21 questions about the coordinate grid and graphing.
Curated OER
Sonar Mapping
Students use a shoe box to create a seafloor model and use cardboard for layering inside of the shoe box to simulate the ocean floor. They probe the ocean floor to simulate sonar echoes. Finally, students graph their data to get a...
Curated OER
The Grand Excursion GPS Map
Eighth graders investigate the uses of a global positioning system. They create waypoints and have to find them using the system. Students must review the geographical concepts of latitude and longitude. The media requirements of the...
Curated OER
Osprey Journey
Learners investigate the migration route of one bird, Osprey B4, using information gathered from satellites to track birds over a two-year period. They coimpare their graphs with maps of B4's migrations that have been plotted by...
Curated OER
Robot Cartography
Students identify points plotted on the coordinate plane. In this geometry lesson, students learn to read a map using concepts of a coordinate plane grid. They find the path given a map to tell them where to go.
Curated OER
2 x 2
Students work together to grid a 2 x 2 meter unit using the formula for the Pythagorean Theorem. After creating the grid, they identify the location of artifacts and create a map of their location. They develop a graph and table of their...


